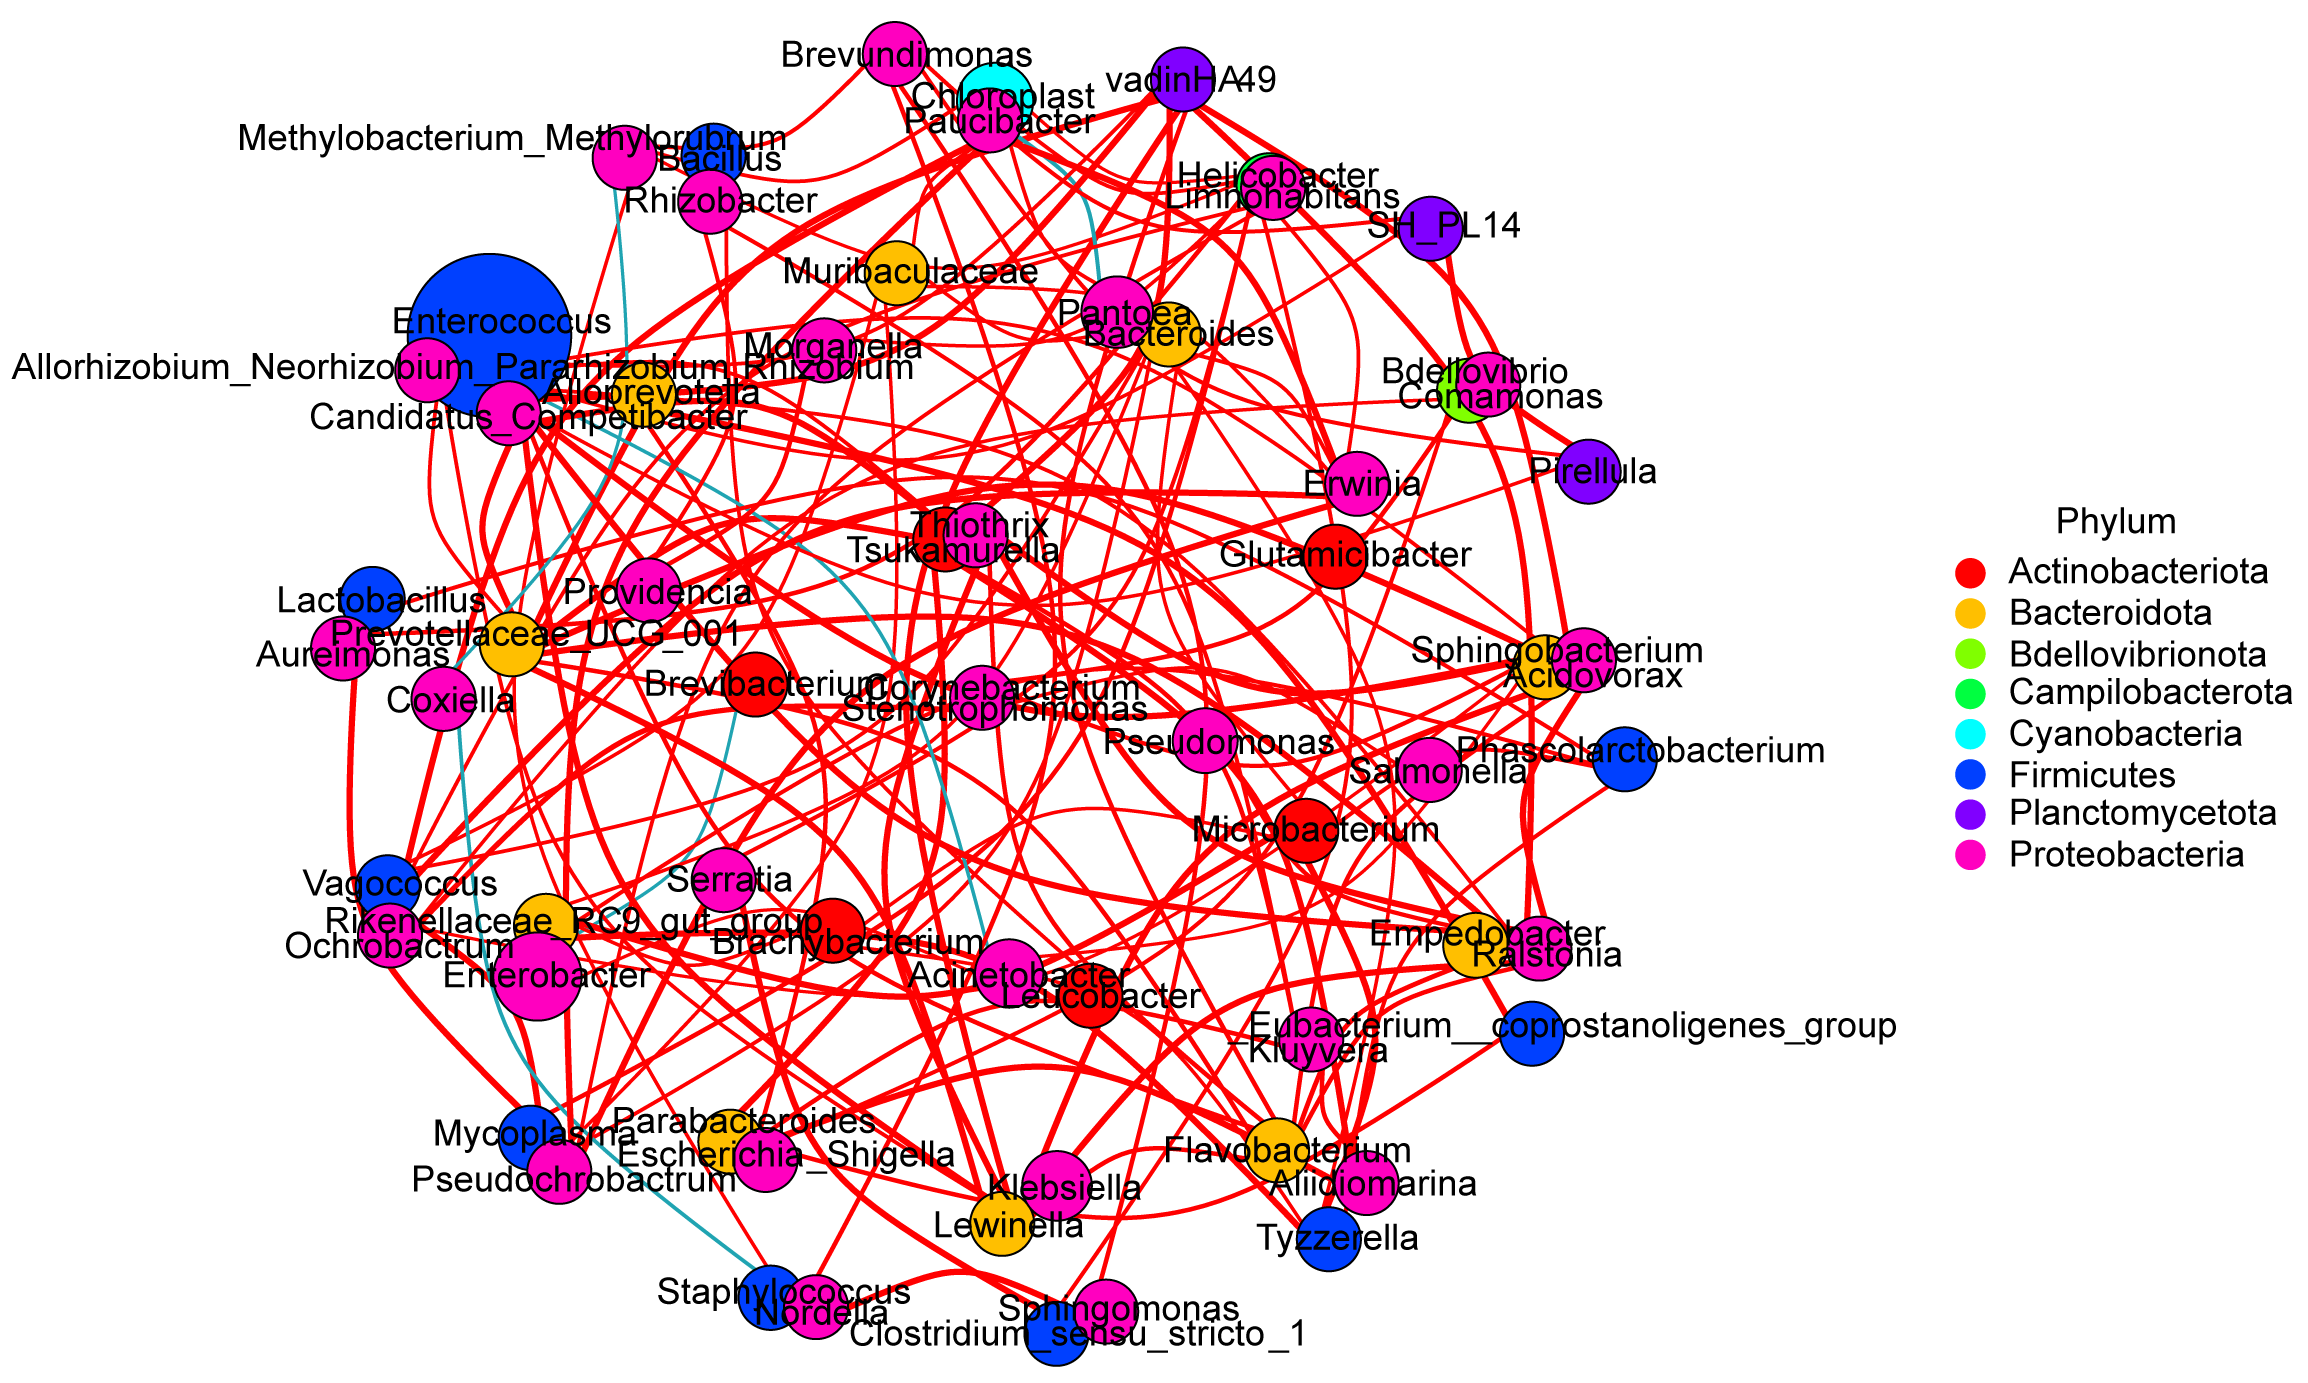
Network analysis of interaction amongst 65 intestinal bacteria genera, based on correlation analysis (Spearman correlation coefficient ρ > 0.5). The node represented unique genera and the size of each node is proportional to the relative abundance. A red edge indicates a positive interaction between two individual nodes, while a blue edge indicates a negative interaction.