|
Biodiversity Data Journal :
Research Article
|
|
Corresponding author:
Academic editor: Vlada Peneva
Received: 26 Sep 2016 | Accepted: 11 Nov 2016 | Published: 15 Nov 2016
© 2016 Oleksandr Holovachov
This is an open access article distributed under the terms of the Creative Commons Attribution License (CC BY 4.0), which permits unrestricted use, distribution, and reproduction in any medium, provided the original author and source are credited.
Citation:
Holovachov O (2016) Metabarcoding of marine nematodes – evaluation of similarity scores used in alignment-based taxonomy assignment approach. Biodiversity Data Journal 4: e10647. https://doi.org/10.3897/BDJ.4.e10647
|
|
Abstract
Background
The diversity of organisms is being commonly accessed using metabarcoding of environmental samples. Reliable identification of barcodes is one of the critical steps in the process and several taxonomy assignment methods were proposed to accomplish this task, including alignment-based approach that uses Basic Local Alignment Search Tool (BLAST) algorithm. This publication evaluates the variability of 5' end of 18S rRNA barcoding region as expressed by similarity scores (alignment score and identity score) produced by BLAST, and its impact on barcode identification to family-level taxonomic categories.
New information
In alignment-based taxonomy assignment approach, reliable identification of anonymous OTUs to supraspecific taxa depends on the correct application of similarity thresholds. Since various taxa show different level of genetic variation, practical application of alignment-based approach requires the determination and use of taxon-specific similarity thresholds.
Keywords
Nematoda, metabarcoding, BLAST, taxonomy assignment, 18S rRNA, OTU, alignment-based approach.
Introduction
Identification of anonymous barcodes clustered in Operational Taxonomic Units (OTUs) is one of the critical steps in metabarcoding studies of living organisms. It can be accomplished via several taxonomy-assignment tools belonging to four different categories: alignment-based, probabilistic, tree-based and phylogeny-based (Holovachov et al., unpublished). Alignment-based approach uses Basic Local Alignment Search Tool (BLAST,
Recent publication describing Classification Resources for Environmental Sequence Tags (CREST,
Barcoding regions are comparatively short and intentionally defined to include hypervariable domains, while the above mentioned rRNA similarity measures are based on comparison of full length sequences that also include highly conserved regions. Thus, similarity measures based on complete genes may or may not reflect variability of the barcoding regions. Moreover, variability of rRNA can be very different in closely related taxa (see the comparison of the families Cephalobidae and Panagrolaimidae below). Published similarity measures (
Materials and Methods
1. Sequence data
SILVA database (
2. Barcoding region
This publication evaluates the variability of the barcoding region of the 18S rRNA gene that includes V1 and V2 variable regions (
3. Analysis
Every barcode-size sequence was manually compared with reference sequences available in the Nucleotide collection (excluding uncultured/environmental sample sequences) of the NCBI database using BLASTN 2.5.0 search algorithm (
- Identity score received by the nearest ingroup taxon (sequence from the same family), i.e., the closest scoring match from the same family that is not the same sequence;
- Identity score received by the furthest ingroup taxon before the first outgroup taxon (sequence from the different family), i.e., the furthest scoring match from the same family immediately preceding the closest scoring match that belongs to a different family;
- Identity score received by the nearest outgroup taxon (sequence from the different family), i.e., the closest scoring match from a different family.
Standard statistical measures (minimum, maximum, averade and standard deviation) were calculated for alignment score, identity score and coverage when appropriate (Suppl. materials
Results
1. Variable coverage
The results of BLAST searches are summarized in Suppl. material
Identity scores for the furthest ingroup taxon and nearest outgroup taxon also varied considerably between different families (Fig.
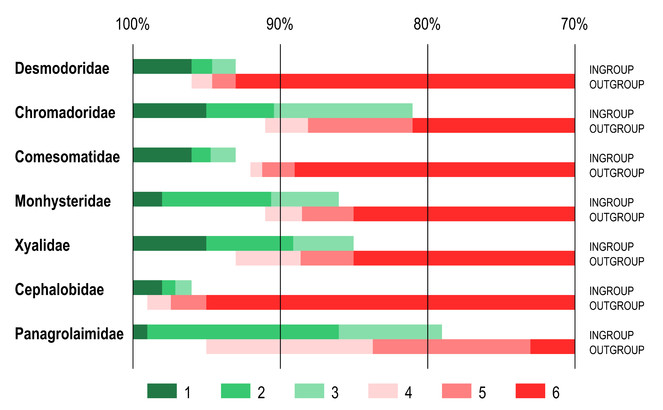
Ranges of identity scores of furthest ingroup taxon and nearest outgroup taxon as revealed by BLAST comparison of query sequences with reference dataset with variable coverage between sequences. Ranges of identity scores. 1 – 100% identity to maximum identity score of the furthest ingroup taxon; 2 – maximum to average identity scores of the furthest ingroup taxon; 3 – average to minimum identity scores of the furthest ingroup taxon; 4 – maximum to average identity scores of the nearest outgroup taxon; 5 – average to minimum identity scores of the nearest outgroup taxon; 6 – minimum identity score of the nearest ingroup taxon to 70% identity threshold.
These two terrestrial families purposely chosen for comparison also present two specific challenges that were not seen in marine families. For example, in the family Cephalobidae in many cases the nearest outgroup taxon with lesser coverage of 94% would receive higher identity score (98-99% identity) than the furthest ingroup taxon with 100% coverage (96-97% identity). The family Panagrolaimidae presented a different challenge – all compared barcodes of the genus Halicephalobus received very low sequence coverage with the furthest ingroup (32%) and nearest outgroup (17-27%) taxa, and found no outgroup sequences with 100% coverage, even though many sequences in the reference database have full overlap with them. This can indicate that BLAST algorithm has difficulties aligning highly modified sequences of Halicephalobus.
2. 100% Coverage
The results of BLAST searches are summarized in Suppl. material
Identity scores for the furthest ingroup taxon and nearest outgroup taxon again showed considerable variation between different families (Fig.
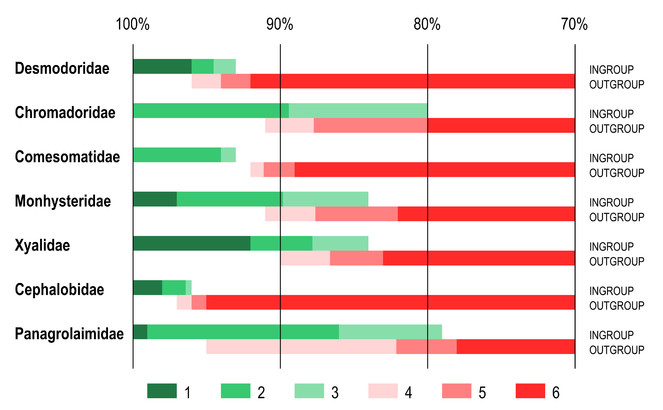
Ranges of identity scores of furthest ingroup taxon and nearest outgroup taxon as revealed by BLAST comparison of query sequences with reference dataset with 100% coverage between sequences. anges of identity scores. 1 – 100% identity to maximum identity score of the furthest ingroup taxon; 2 – maximum to average identity scores of the furthest ingroup taxon; 3 – average to minimum identity scores of the furthest ingroup taxon; 4 – maximum to average identity scores of the nearest outgroup taxon; 5 – average to minimum identity scores of the nearest outgroup taxon; 6 – minimum identity score of the nearest ingroup taxon to 70% identity threshold.
Limiting searches to sequences with 100% overlap affected two specific issues with the families Cephalobidae and Panagrolaimidae described above (Results 1. Variable coverage). In the family Cephalobidae the nearest outgroup taxon no longer have higher identity score than the furthest ingroup taxon (for same query sequence), making identifiication more reliable. In the case of the family Panagrolaimidae, limiting searches to sequences with 100% overlap produced no nearest outgroup hits for the genus Halicephalobus.
Discussion
Similarity thresholds
Only in one out of five analyzed families of marine nematodes, there was no overlap in ranges of identity scores between furthest ingroup taxon and nearest outgroup taxon. Remaining four marine and two terrestrial families showed considerable overlap between both values (identity score of the furthest ingroup taxon and identity score of the nearest outgroup taxon). Moreover, both values showed substantially different variability ranges and average values depending on the taxon in-question. It suggests that universal similarity thresholds applied to nematodes need to be used with great caution.
Even considering only highest scoring hits of the BLAST searches for alignment-based identification of OTUs should be done with great care. Due to scarcity of nematode reference dataset, many highest scoring hits have very low identity scores, especially in case when only 100% overlapping sequences are considered. In this analysis, nearest ingroup scores for some sequences from the family Chromadoridae were as low as 86%, thus using 95% or even 90% similarity threshold to assign anonymous OTUs to families will treat such cases unidentifiable. This problem can not be solved by broadening similarity cutoffs, as it will increase incorrect taxon assignment for all families, but only by filling in the gaps in the reference databases by specifically targeting those species and genera for which no sequence data is available.
Impact of sequence coverage
Level of overlap between query and reference sequence has certain impact on identity scores in particular and on the identification process in general. While performing BLAST searches, I noticed numerous cases when outgorup taxa with lower coverage received higher identity scores than ingroup taxa with more complete coverage. On the other hand, limiting BLAST searches to sequences with only 100% coverage effectively limits the range of reference taxa to compare with – as already described in
Problematic sequences
Presence of erroneous sequences in reference databases and its impact on identification of anonymous OTUs had been extensively discussed and illustrated (
Conclusions
The diversity of nematodes is seriously underrepresented in reference databases used for identification of anonymous barcodes (OTUs). When using alignment-based taxonomy assignment tools to identify nematode OTUs, it is important to know both (1) the lowest similarity thresholds that can be confidently applied to assign OTUs to supraspecific taxa, in order to maximize the efficiency of identification; and (2) the highest similarity thresholds that can ensure minimum number of mis-assigned OTUs.
Targeted sequencing of reference taxa from underrepresented nematode families is expected to improve the efficiency of alignment-based taxonomy assignment approach. Two groups of taxa should be specifically considered: (1) those species that are completely missing from the reference databases, and (2) those species, which sequences (already available in reference databases) do not have full coverage with the barcoding region used in metabarcoding studies.
It is also important to understand that universal similarity thresholds can only be applied with great caution, that taxon-specific similarity thresholds may be more effective to use, and that other taxonomy assignment methods may be more reliable for a particular dataset (Holovachov et al., in press).
Grant title
Project entitled Systematics of Swedish free-living nematodes of the orders Desmodorida and Araeolaimida financed by the Swedish Taxonomy Initiative, Artdatabanken, Sweden.
References
- Basic local alignment search tool.Journal of molecular biology215:403‑410. https://doi.org/10.1016/S0022-2836(05)80360-2
- Dramatic Shifts in Benthic Microbial Eukaryote Communities following the Deepwater Horizon Oil Spill.PLoS ONE7:e38550. https://doi.org/10.1371/journal.pone.0038550
- Metagenetic community analysis of microbial eukaryotes illuminates biogeographic patterns in deep-sea and shallow water sediments.Molecular Ecology21:1048‑1059. https://doi.org/10.1111/j.1365-294x.2011.05297.x
- Blaxter M, Koutsovoulos G, Jones M, Kumar S, Elsworth B (2016) Phylogenomics of Nematoda. In: Olson PD, Hughes J, Cotton JA (Eds) Next Generation Systematics.Cambridge University Press
- QIIME allows analysis of high-throughput community sequencing data.Nature Methods7:335‑336. https://doi.org/10.1038/nmeth.f.303
- Cole JR, Konstantinidis K, Farris RJ, Tiedje JM (2010) Microbial Diversity and Phylogeny: Extending from rRNAs to Genomes. In: Liu WY, Jansson JK (Eds) Environmental Molecular Microbiology.Caister Academic Press
- Metabarcoding Is Powerful yet Still Blind: A Comparative Analysis of Morphological and Molecular Surveys of Seagrass Communities.PLOS ONE10:e0117562. https://doi.org/10.1371/journal.pone.0117562
- Ultrasequencing of the meiofaunal biosphere: practice, pitfalls and promises.Molecular Ecology19:4‑20. https://doi.org/10.1111/j.1365-294x.2009.04473.x
- Molecular barcodes for soil nematode identification.Molecular Ecology11:839‑850. https://doi.org/10.1046/j.1365-294x.2002.01485.x
- Metagenetic analysis of patterns of distribution and diversity of marine meiobenthic eukaryotes.Global Ecology and Biogeography23:1293‑1302. https://doi.org/10.1111/geb.12223
- Second-generation environmental sequencing unmasks marine metazoan biodiversity.Nature Communications1:98. https://doi.org/10.1038/ncomms1095
- Large-Scale Biomonitoring of Remote and Threatened Ecosystems via High-Throughput Sequencing.PLOS ONE10:e0138432. https://doi.org/10.1371/journal.pone.0138432
- TaxCollector: Modifying Current 16S rRNA Databases for the Rapid Classification at Six Taxonomic Levels.Diversity2:1015‑1025. https://doi.org/10.3390/d2071015
- Metabarcoding of marine nematodes – evaluation of reference datasets used in tree-based taxonomy assignment approach.Biodiversity Data Journal4:e10021. https://doi.org/10.3897/bdj.4.e10021
- Predicting microbial species richness.Proceedings of the National Academy of Sciences103:117‑122. https://doi.org/10.1073/pnas.0507245102
- jMOTU and Taxonerator: Turning DNA Barcode Sequences into Annotated Operational Taxonomic Units.PLoS ONE6:e19259. https://doi.org/10.1371/journal.pone.0019259
- CREST – Classification Resources for Environmental Sequence Tags.PLoS ONE7:e49334. https://doi.org/10.1371/journal.pone.0049334
- Next Generation Sequencing Reveals the Hidden Diversity of Zooplankton Assemblages.PLoS ONE8:e81327. https://doi.org/10.1371/journal.pone.0081327
- Madden T (2002) Chapter 16. The BLAST sequence analysis tool. The NCBI Handbook.
- High-Throughput Sequencing—The Key to Rapid Biodiversity Assessment of Marine Metazoa?PLOS ONE10:e0140342. https://doi.org/10.1371/journal.pone.0140342
- The SILVA ribosomal RNA gene database project: improved data processing and web-based tools.Nucleic Acids Research41:D590‑D596. https://doi.org/10.1093/nar/gks1219
- Status of the Microbial Census.Microbiology and Molecular Biology Reviews68:686‑691. https://doi.org/10.1128/mmbr.68.4.686-691.2004
- iDNA from terrestrial haematophagous leeches as a wildlife surveying and monitoring tool – prospects, pitfalls and avenues to be developed.Frontiers in Zoology12:1. https://doi.org/10.1186/s12983-015-0115-z
- Worldwide Analysis of Sedimentary DNA Reveals Major Gaps in Taxonomic Knowledge of Deep-Sea Benthos.Frontiers in Marine Science3:1. https://doi.org/10.3389/fmars.2016.00092