|
Biodiversity Data Journal :
Data Paper (Biosciences)
|
|
Corresponding author: Écio Souza Diniz (eciodiniz@gmail.com)
Academic editor: Quentin Groom
Received: 05 May 2017 | Accepted: 12 Jul 2017 | Published: 19 Jul 2017
© 2017 Écio Diniz, Warley Carvalho, Rubens Santos, Markus Gastauer, Paulo Garcia, Marco Fontes, Polyanne Coelho, Aline Moreira, Gisele Menino, Ary Oliveira-Filho
This is an open access article distributed under the terms of the Creative Commons Attribution License (CC BY 4.0), which permits unrestricted use, distribution, and reproduction in any medium, provided the original author and source are credited.
Citation:
Diniz É, Carvalho W, Santos R, Gastauer M, Garcia P, Fontes M, Coelho P, Moreira A, Menino G, Oliveira-Filho A (2017) Long-term monitoring of diversity and structure of two stands of an Atlantic Tropical Forest. Biodiversity Data Journal 5: e13564. https://doi.org/10.3897/BDJ.5.e13564
|
|
Abstract
Background
This study aimed to report the long-term monitoring of diversity and structure of the tree community in a protected semideciduous Atlantic Forest in the South of Minas Gerais State, Southeast Brazil. The study was conducted in two stands (B and C), each with 26 and 38 10 m x 30 m plots. Censuses of stand B were conducted in 2000, 2005 and 2011, and stand C in 2001, 2006 and 2011. In both stands, the most abundant and important species for biomass accumulation over the inventories were trees larger than 20 cm of diameter, which characterize advanced successional stage within the forest.
New information
The two surveyed stands within the studied forest presented differences in structure, diversity and species richness over the time.
Keywords
Long-term monitoring, Succession, Diversity
Introduction
The formation of the structure of tropical forests is governed by a wide range of factors (e.g. abiotic, biotic, neutral and natural or anthropogenic disturbance) (
Long-term research (community dynamics) is a vital tool in elucidating the causes of a wide range of ecological patterns and processes in plant communities (
Due to its ecological complexity, its endemic biodiversity and its threats by anthropogenic activities (e.g. agriculture, mining), the Brazilian Atlantic Forest is considered one of 25 hotspots of biodiversity (
Project description
Population and community dynamics of a semideciduous forest from south Minas Gerais, Brazil
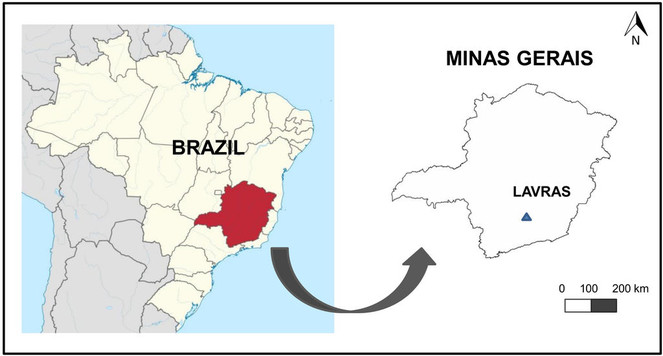
The Parque Ecológico Quedas do Rio Bonito (PEQRB; “Falls of Nice River Ecological Park”) belongs to the Abraham Kasinski Foundation (FAK) and is located in the municipality of Lavras, in the Southern region of Minas Gerais State (
Within the park, the forest is distributed among valleys, on slopes and adjacent to watercourses, forming a heterogeneous environmental gradient with the occurence of typical mountain forest species such as Protium widgrenii Engl. (Burseraceae), Clethra scabra Pers. (Clethraceae), Podocarpus sellowii Klotzsch ex Endl. (Podocarpaceae), Euplassa incana (Klotzsch) I.M.Johnst. (Proteaceae) and Drimys brasiliensis Miers (Winteraceae) (
In 1999, 90% of the current area of the PEQRB was designated as protected in a decree from Lavras’ city hall, which includes the assignment to FAK. Before it was designated as a protected area, the PEQRB was subject to various disturbances. Disturbances such as free movement of cattle, logging for charcoal production and construction of housing and recreational areas (
Sampling methods
Investigation of floristic and structural composition of the tree community in PEQRB, its distribution over soil habitats and evaluation of the interaction of plants with environmental factors, were studied by
The stands were arranged as transects (Fig.
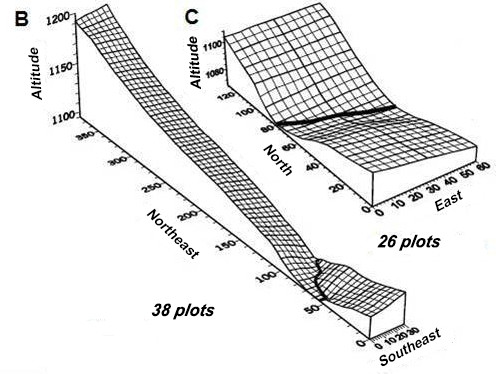
Surface grid of the sampled transects of each stand (B and C) studied in the forest of the PEQRB, in the municipality of Lavras, Minas Gerais State, Souheast of Brazil. The size of each plot in both stands was 30 x 10 meters. The spacing between grid lines is 5 meters. Adapted from
Individuals were identified either in the field or through collection of samples of whole branches, leaves, and where possible, fruits. These samples were then compared with the existing collection present in herbarium “Herbário ESAL” of the Federal University of Lavras. In addition, samples were verified using appropriate literature and where necessary, specialists were consulted. The classification system followed that of the
Data analyses
Species diversity and richness
Species richness was compared between stands B and C stands using a Wilcoxon Rank Sum Test. The species diversity and evenness per stand were calculated by Shannon-Weaver (H) and Pielou (J) respectively, using the package “vegan” (
Tree Dynamics
The changes in the tree community over the time were determined for each stand by calculating the annual mean rates of mortality (M) and recruitment (R) of individuals (based on species abundance) and basal area loss (L) and gain (G) according to
Tree Dynamics per diameter classes
Diameter classes with increasing amplitudes were created (5-10 cm, >10-20 cm, >20-40 cm and >40-80 cm). This approach compensates for the sizeable decrease in abundance of the largest diameter individuals, which is a pattern commonly observed in tree diameter measurements and is characterized by the negative exponential distribution (
To verify whether the frequency of dead trees within each stand (B: 2005 and 2011; C: 2006 and 2011) were dependent on diameter classes based on the frequencies expected from the second and last inventory diameter distribution
Dynamics of the most abundant species
The 10 most abundant species in each stand were selected and their mortality and recruitment rates were calculated. These species were also classified into regeneration guilds following the descriptions of
Geographic coverage
The Parque Ecológico Quedas do Rio Bonito (PEQRB; “Falls of Nice River Ecological Park”) is a particular protected with 235 hectares, located in the municipality of Lavras, in the Southern region of Minas Gerais State, with altitudes varying between 950 and 1200 metes.
21°19' and ; 44°59' and .
Taxonomic coverage
Results
Structure, diversity and species richness
In stand B, the survey which took place in the year 2000 identified 1364 trees from 118 species (83 genera, 50 families); in 2005, 1313 trees in from 115 species were identified (80 genera, 48 families) and in 2011, 1251 trees from 106 species (75 genera, 46 families) were identified (Table
Families and species: presence and absence in the stands B and C of the Semideciduous Atlantic Forest at Parque Ecológico Quedas do Rio Bonito (PEQRB), municipality of Lavras, South of Minas Gerais State, Southeast Brazil.
|
Families/Species |
Presence/Absence |
|||||
|
B |
C |
|||||
|
2000 |
2005 |
2011 |
2001 |
2006 |
2011 |
|
| Anacardiaceae | ||||||
| Tapirira guianensis Aubl. | x | x | x | x | x | x |
| Tapirira obtusa (Benth.) J.D.Mitchell | x | x | x | x | x | x |
| Annonaceae | ||||||
| Annona cacans Warm. | x | x | x | x | x | x |
| Annona neolaurifolia H.Rainer | - | - | - | x | x | x |
| Annona neosericea H.Rainer | - | - | - | x | x | x |
| Annona sylvatica A.St.-Hil. | - | - | - | x | x | x |
| Guatteria australis A.St.-Hil. | x | x | x | x | x | x |
| Xylopia brasiliensis Spreng. | x | x | x | x | x | x |
| Apocynaceae | ||||||
| Aspidosperma australe Müll.Arg. | x | x | x | x | x | x |
| Aspidosperma olivaceum Müll.Arg. | x | x | x | x | x | x |
| Aspidosperma spruceanum Benth. ex Müll.Arg. | - | - | - | x | x | x |
| Aquifoliaceae | ||||||
| Ilex cerasifolia Reissek | x | x | x | x | x | x |
| Ilex conocarpa Reissek | x | x | - | x | x | x |
| Ilex paraguariensis A.St.-Hil. | x | x | x | - | - | - |
| Ilex sapotifolia Reissek | x | x | x | - | - | - |
| Araliaceae | ||||||
| Dendropanax cuneatus (DC.) Decne. & Planch. | - | - | - | x | x | x |
| Schefflera calva (Cham.) Frodin & Fiaschi | - | - | - | x | x | x |
| Arecaceae | ||||||
| Geonoma pohliana Mart. | - | - | - | x | x | x |
| Geonoma schottiana Mart. | x | x | x | x | x | x |
| Syagrus flexuosa (Mart.) Becc. | - | - | - | x | x | x |
| Asteraceae | ||||||
| Austrocritonia velutina (Gardner) R.M.King & H.Rob. | - | x | - | - | - | - |
| Baccharis oblongifolia (Ruiz & Pav.) Pers. | x | x | - | - | - | - |
| Eremanthus erythropappus (DC.) MacLeish | x | x | x | x | x | x |
| Piptocarpha axillaris (Less.) Baker | - | - | - | x | x | x |
| Piptocarpha macropoda Baker | - | - | - | x | x | x |
| Vernonanthura divaricata (Spreng.) H.Rob. | - | - | - | x | x | x |
| Bignoniaceae | ||||||
| Handroanthus serratifolius (Vahl) S.O.Grose | - | - | - | x | x | x |
| Jacaranda macrantha Cham | x | x | x | x | x | x |
| Jacaranda puberula Cham. | - | - | - | x | x | x |
| Boraginaceae | ||||||
| Cordia sellowiana Cham. | x | x | x | x | x | x |
| Burseraceae | ||||||
| Protium heptaphyllum (Aubl.) Marchand | - | x | - | - | - | - |
| Protium spruceanum (Benth.) Engl. | x | x | x | - | x | - |
| Protium widgrenii Engl. | x | x | x | x | x | x |
| Celastraceae | ||||||
| Maytenus communis Reissek | x | x | x | x | x | x |
| Maytenus evonymoides Reissek | - | - | - | x | x | x |
| Maytenus gonoclada Mart. | x | x | x | x | x | x |
| Maytenus salicifolia Reissek | x | x | x | x | x | x |
| Salacia elliptica (Mart. ex Schult.) G.Don | x | x | x | x | x | x |
| Chrysobalanaceae | ||||||
| Hirtella hebeclada Moric. ex DC. | x | x | x | - | - | - |
| Clethraceae | ||||||
| Clethra scabra Pers. | x | x | x | x | x | x |
| Clusiaceae | ||||||
| Calophyllum brasiliense Cambess. | - | - | - | x | x | x |
| Garcinia gardneriana (Planch. & Triana) Zappi | - | - | - | x | x | x |
| Kielmeyera lathrophyton Saddi | x | - | - | - | - | - |
| Combretaceae | ||||||
| Terminalia glabrescens Mart. | - | - | - | x | x | - |
| Connaraceae | ||||||
| Connarus regnellii G.Schellenb. | - | - | - | x | x | x |
| Cunoniaceae | ||||||
| Lamanonia ternata Vell. | x | x | - | x | - | - |
| Cyatheaceae | ||||||
| Alsophila sternbergii (Pohl ex Sternb.) Conant | x | - | - | - | - | - |
| Cyathea delgadii Sternb. | x | x | x | - | - | - |
| Cyathea gardneri Hook. | x | x | x | - | - | - |
| Cyathea phalerata Mart. | x | x | x | x | x | x |
| Elaeocarpaceae | ||||||
| Sloanea hirsuta (Schott) Planch. ex Benth | x | x | x | x | x | x |
| Euphorbiaceae | ||||||
| Alchornea glandulosa Poepp. & Endl. | - | - | - | x | x | x |
| Alchornea triplinervia (Spreng.) Müll.Arg. | x | x | x | x | x | x |
| Croton echinocarpus Müll.Arg. | x | x | x | x | x | x |
| Croton floribundus Spreng. | x | x | x | x | x | x |
| Pera glabrata (Schott) Poepp. ex Baill. | x | x | x | x | x | x |
| Sapium glandulosum (L.) Morong | - | - | - | x | x | x |
| Sebastiania commersoniana (Baill.) L.B.Sm. & Downs | x | x | x | x | x | x |
| Fabaceae Caesalpinioideae | ||||||
| Cassia ferruginea (Schrad.) Schrad. ex DC. | - | - | - | x | x | x |
| Copaifera langsdorffii Desf. | x | x | x | x | x | x |
| Senna macranthera (DC. ex Collad.) H.S.Irwin & Barneby | - | - | - | - | x | x |
| Tachigali rugosa (Mart. ex Benth.) Zarucchi & Pipoly | x | x | x | x | x | x |
| Fabaceae Faboideae | ||||||
| Dalbergia frutescens (Vell.) Britton | x | x | - | x | x | - |
| Dalbergia villosa (Benth.) Benth. | x | x | x | x | x | x |
| Erythrina falcata Benth. | - | - | - | x | - | x |
| Machaerium nictitans (Vell.) Benth. | - | - | - | x | x | x |
| Machaerium villosum Vogel | x | x | x | x | x | x |
| Platycyamus regnellii Benth. | - | - | - | x | x | x |
| Fabaceae Mimosoideae | ||||||
| Inga ingoides (Rich.) Willd. | - | - | - | x | x | x |
| Inga marginata Willd. | - | - | - | x | x | x |
| Inga striata Benth. | - | - | - | x | x | x |
| Inga vera Willd. | - | - | - | x | x | x |
| Leucochloron incuriale (Vell.) Barneby & J.W.Grimes | x | x | x | x | x | x |
| Piptadenia gonoacantha (Mart.) Macbr. | - | - | - | x | x | x |
| Pseudopiptadenia leptostachya (Benth.) Rausch. | - | - | - | x | x | x |
| Humiriaceae | ||||||
| Humiriastrum glaziovii (Urb.) Cuatrec. | x | - | - | - | - | - |
| Sacoglottis mattogrossensis Malme | x | x | x | - | - | - |
| Hypericaceae | ||||||
| Vismia brasiliensis Choisy | x | x | x | x | x | x |
| Lacistemataceae | ||||||
| Lacistema hasslerianum Chodat | x | x | x | x | x | x |
| Lamiaceae | ||||||
| Aegiphila verticillata Vell. | - | - | - | - | - | x |
| Vitex megapotamica (Spreng.) Moldenke | x | x | x | x | x | x |
| Vitex polygama Cham. | x | x | x | x | x | x |
| Lauraceae | ||||||
| Aniba firmula (Nees & Mart.) Mez | x | x | x | - | - | - |
| Cinnamomum glaziovii (Mez) Kosterm. | x | x | x | x | - | - |
| Cryptocarya aschersoniana Mez | x | x | x | x | x | x |
| Endlicheria paniculata (Spreng.) J.F.Macbr. | - | - | - | x | - | - |
| Nectandra grandiflora Nees | x | x | x | x | x | x |
| Nectandra megapotamica (Spreng.) Mez | x | x | x | - | - | - |
| Nectandra nitidula Nees | - | - | - | - | x | x |
| Nectandra oppositifolia Nees | x | x | x | x | x | x |
| Ocotea aciphylla (Nees & Mart.) Mez | x | x | x | x | - | - |
| Ocotea brachybotrya (Meisn.) Mez | x | - | - | x | - | - |
| Ocotea corymbosa (Meisn.) Mez | x | x | x | x | x | x |
| Ocotea diospyrifolia (Meisner) Mez | - | - | - | x | x | x |
| Ocotea indecora (Schott) Mez | - | - | - | x | x | x |
| Ocotea odorifera (Vell.) Rohwer | x | x | x | x | x | x |
| Ocotea pulchella (Nees & Mart.) Mez | x | x | x | x | x | x |
| Persea major L.E.Kopp | x | x | x | x | x | x |
| Persea willdenovii Kosterm. | x | x | - | x | x | - |
| Lecythidaceae | ||||||
| Cariniana legalis (Mart.) Kuntze | - | - | - | x | x | x |
| Lythraceae | ||||||
| Lafoensia glyptocarpa Koehne | - | - | - | - | - | x |
| Lafoensia pacari A.St.-Hil. | x | x | x | x | x | x |
| Magnoliaceae | ||||||
| Magnolia ovata (A.St.-Hil.) Spreng. | x | - | - | - | - | - |
| Malpighiaceae | ||||||
| Byrsonima laxiflora Griseb. | x | x | x | x | x | x |
| Heteropterys byrsonimifolia A.Juss. | x | x | x | - | - | - |
| Malvaceae | ||||||
| Luehea grandiflora Mart. & Zucc. | x | x | x | - | - | - |
| Melastomataceae | ||||||
| Leandra melastomoides Raddi | x | - | - | - | - | - |
| Miconia chartacea Triana | x | x | x | x | x | x |
| Miconia cinnamomifolia (DC.) Naudin | x | x | x | x | x | x |
| Miconia latecrenata (DC.) Naudin | - | - | - | - | x | x |
| Miconia sellowiana Naudin | x | x | x | x | x | x |
| Tibouchina stenocarpa (DC.) Cogn. | - | - | - | x | x | x |
| Meliaceae | ||||||
| Cabralea canjerana (Vell.) Mart. | x | x | x | x | x | x |
| Cedrela fissilis Vell. | - | - | - | x | x | x |
| Guarea macrophylla Vahl | - | - | - | - | x | - |
| Trichilia elegans A.Juss. | - | - | - | x | x | x |
| Monimiaceae | ||||||
| Mollinedia argyrogyna Perkins | x | x | x | x | x | x |
| Moraceae | ||||||
| Sorocea bonplandii (Baill.) W.C.Burger, Lanj. & Wess.Boer | x | x | x | x | x | x |
| Myrtaceae | ||||||
| Blepharocalyx salicifolius (Kunth) O.Berg | x | x | x | x | x | x |
| Calyptranthes clusiifolia (Miq.) O.Berg | x | x | x | x | x | x |
| Calyptranthes widgreniana O.Berg | x | x | x | - | - | x |
| Campomanesia guaviroba (DC.) Kiaersk. | - | - | - | x | x | x |
| Campomanesia guazumifolia (Cambess.) O.Berg | - | - | - | x | x | x |
| Eugenia acutata Miq. | - | - | - | x | x | x |
| Eugenia dodonaeifolia Cambess. | - | - | - | x | x | x |
| Eugenia florida DC. | - | - | - | x | x | x |
| Eugenia handroana D.Legrand | x | x | x | - | - | - |
| Eugenia hyemalis Cambess. | x | x | x | x | x | x |
| Marlierea racemosa (Vell.) Kiaersk. | x | x | x | x | x | x |
| Myrceugenia miersiana (Gardner) D.Legrand & Kausel | - | - | - | x | x | x |
| Myrcia eriocalyx DC. | x | x | x | x | - | - |
| Myrcia guianensis (Aubl.) DC. | - | - | - | x | x | x |
| Myrcia hebepetala DC. | x | x | x | x | x | x |
| Myrcia obovata (O.Berg) Nied. | x | x | x | x | x | x |
| Myrcia pulchra (O.Berg) Kiaersk. | x | x | x | - | - | - |
| Myrcia splendens (Sw.) DC. | x | x | x | x | x | x |
| Myrcia tomentosa (Aubl.) DC. | - | - | - | x | x | x |
| Myrcia venulosa DC. | x | x | x | x | x | x |
| Myrciaria floribunda (H.West ex Willd.) O.Berg | x | x | x | x | x | x |
| Myrceugenia rufescens (DC.) D.Legrand & Kausel | - | - | x | - | - | - |
| Pimenta pseudocaryophyllus (Gomes) Landrum | x | x | - | x | x | x |
| Siphoneugena densiflora O.Berg | x | x | x | x | x | x |
| Siphoneugena widgreniana O.Berg | - | - | - | x | x | x |
| Syzygium jambos (L.) Alston | - | - | - | x | x | x |
| Nyctaginaceae | ||||||
| Guapira opposita (Vell.) Reitz | x | x | x | x | x | x |
| Olacaceae | ||||||
| Heisteria silvianii Schwacke | x | x | x | x | x | x |
| Opiliaceae | ||||||
| Agonandra excelsa Griseb. | - | - | - | x | x | x |
| Pentaphylacaceae | ||||||
| Ternstroemia brasiliensis Cambess. | x | x | x | x | x | x |
| Piperaceae | ||||||
| Piper cernuum Vell. | - | - | - | x | x | x |
| Phyllanthaceae | ||||||
| Hieronyma alchorneoides Allemão | x | x | x | - | - | - |
| Polygonaceae | ||||||
| Coccoloba alnifolia Casar. | - | - | - | x | x | x |
| Coccoloba warmingii Meisn. | x | x | x | x | x | x |
| Ruprechtia laxiflora Meisn. | x | x | x | x | x | x |
| Primulaceae | ||||||
| Myrsine gardneriana A.DC. | x | x | x | - | x | x |
| Myrsine guianensis (Aubl.) Kuntze | x | x | - | - | - | - |
| Myrsine lineata (Mez) Imkhan. | x | x | x | - | - | - |
| Myrsine umbellata Mart. | x | x | x | x | x | x |
| Proteaceae | ||||||
| Euplassa legalis (Vell.) I.M.Johnst. | x | x | x | x | x | x |
| Euplassa organensis (Gardner) I.M.Johnst. | - | - | - | x | - | x |
| Roupala montana Aubl. | x | x | x | x | x | x |
| Rosaceae | ||||||
| Prunus myrtifolia (L.) Urb. | x | x | x | x | x | x |
| Rubiaceae | ||||||
| Amaioua intermedia Mart. ex Schult. & Schult.f. | x | x | x | x | x | x |
| Cordiera concolor (Cham.) Kuntze | x | x | x | x | x | x |
| Faramea nigrescens Mart. | x | x | x | x | x | x |
| Ixora brevifolia Benth. | x | x | x | x | x | x |
| Psychotria vellosiana Benth. | x | x | x | x | x | x |
| Rudgea jasminoides (Cham.) Müll.Arg. | - | - | - | x | x | x |
| Rutaceae | ||||||
| Metrodorea stipularis Mart. | - | - | - | x | x | x |
| Zanthoxylum fagara (L.) Sarg. | - | - | - | x | x | x |
| Zanthoxylum rhoifolium Lam. | - | - | - | x | x | x |
| Sabiaceae | ||||||
| Meliosma sellowii Urb. | - | - | - | x | x | - |
| Salicaceae | ||||||
| Casearia decandra Jacq. | x | x | x | x | x | x |
| Casearia obliqua Spreng. | x | x | x | x | x | x |
| Casearia sylvestris Sw. | x | x | x | x | x | x |
| Casearia ulmifolia Vahl | x | x | x | - | - | - |
| Xylosma ciliatifolia (Clos) Eichler | - | - | - | x | x | x |
| Xylosma prockia (Turcz.) Turcz. | - | - | - | x | x | x |
| Sapindaceae | ||||||
| Allophylus semidentatus (Miq.) Radlk. | - | - | - | x | x | x |
| Cupania zanthoxyloides Cambess. | x | x | x | x | x | x |
| Matayba guianensis Aubl. | x | x | x | x | x | x |
| Matayba juglandifolia Radlk. | - | - | - | x | x | x |
| Solanaceae | ||||||
| Solanum leucodendron Sendtn. | - | - | - | x | x | x |
| Solanum pseudoquina A.St.-Hil. | - | - | - | x | x | x |
| Styracaceae | ||||||
| Styrax latifolius Pohl | x | x | x | x | x | x |
| Symplocaceae | ||||||
| Symplocos celastrinea Mart. ex Miq. | x | x | x | x | x | x |
| Thymelaeaceae | ||||||
| Daphnopsis brasiliensis Mart. & Zucc. | - | - | - | x | x | x |
| Daphnopsis fasciculata (Meisn.) Nevling | x | x | x | x | x | - |
| Daphnopsis utilis Warm. | - | x | x | x | x | x |
| Urticaceae | ||||||
| Cecropia glaziovii Snethl. | x | x | - | x | x | x |
| Urera baccifera (L.) Gaudich. ex Wedd. | - | - | - | x | x | x |
| Vochysiaceae | ||||||
| Qualea cordata (Mart.) Spreng. | - | - | - | x | x | x |
| Qualea dichotoma (Mart.) Warm. | x | x | x | - | - | - |
| Qualea multiflora Mart. | - | - | - | x | x | x |
| Vochysia magnifica Warm. | - | - | - | x | x | x |
| Vochysia tucanorum Mart. | x | x | x | x | x | x |
Tree stand structure, diversity and species richness from two stands (B and C) in the Semideciduous Forest at the Parque Ecológico Quedas do Rio Bonito (PEQRB), municipality of Lavras, South of Minas Gerais State, Southeast Brazil.
N ind = total number of individuals; N Species = species richness; N (tree ha-1) = number of individual per hectare; BA (m2 ha-1) = Basal area per hectare;Total BA = total basal area; H’ = Shannon-Weaver index (nats. indivídual-1); J = Pielou’s evenness index. A letter in the census of one stand followed by a different letter in the census of the another stand indicates significant difference in the comparisons. N ind was not significant different neither within nor among stands comparisons in all censuses. Total BA did not differ over censuses within each stand, but was different in all censuses comparisons among the two stands.
| Parameters |
B |
C |
||||
| Censuses | 2000 | 2005 | 2011 | 2001 | 2006 | 2011 |
| N ind | 1364a | 1313 a | 1251 a | 1941 a | 1970 a | 1810 a |
| N (tree ha-1) | 1748.7 | 1683.3 | 1603.8 | 1702.6 | 1728.0 | 1587.7 |
| BA (m2 ha-1) | 19.02 | 20.03 | 21.23 | 24.52 | 25.81 | 26.94 |
| Total BA | 14.83 a | 15.62 a | 16.56 a | 27.95 b | 29.42 b | 30.71 b |
| N Species | 118 a | 115 a | 106 a | 157 b | 160 b | 157 b |
| H’ | 3.97 a | 3.94 a | 3.86 a | 4.36 b | 4.36 b | 4.40 b |
| J | 0.83 | 0.83 | 0.82 | 0.86 | 0.85 | 0.87 |
In the stand B there was no significant difference in total basal area (F = 0.53, p = 0.593) or in total number of individuals (F = 0.23, p = 0.791) across all censuses. The same was evident in total basal area (F = 1.28, p = 0.279) and total number of individuals (F = 1.61, p = 0.201) in stand C (Table
The monitoring period of 11 years in stand B presented a decrease in the number of individuals per hectare, and an increase in basal area per hectare, from 2000 to 2011 (Table
Tree Dynamics
There was a decrease in abundance and increases in basal area during both intervals in stand B (2000-2005 and 2005-2011; Table
The dynamic tree components of two stands (B and C) in a Semi-deciduous Forest in the Parque Ecológico Quedas do Rio Bonito, municipality of Lavras, South of Minas Gerais State, Southeast Brazil. Dec. = decrease; Inc. = increase.
| Stands: |
Stretch B |
Stretch C |
||
| 2000/2005 | 2005/2011 | 2001/2006 | 2006/2011 | |
| Sampling: | ||||
| Number of plots | 26 | 26 | 38 | 38 |
| Number of trees: | ||||
| Initial | 1364 | 1313 | 1941 | 1970 |
| Final | 1313 | 1251 | 1970 | 1810 |
| Survival | 1188 | 1128 | 1770 | 1631 |
| Dead | 176 | 187 | 171 | 339 |
| Recruits | 125 | 123 | 200 | 179 |
| Mortality rate (%.year-1) | 2.72 | 3.02 | 1.82 | 3.70 |
| Recruitment rate (%.year-1) | 1.98 | 1.63 | 2.11 | 1.71 |
| Turnover rate (%.year-1) | 2.35 | 2.45 | 1.97 | 2.71 |
| Net change rate (%.year-1) | -0.75 | -0.96 | 0.29 | -1.67 |
| Basal area: | ||||
| Initial | 14.83 | 15.62 | 27.95 | 29.42 |
| Final | 15.62 | 16.56 | 29.42 | 30.71 |
| Dead (m2) | 1.83 | 1.85 | 2.15 | 3.38 |
| Dec. survival (m2) | 0.05 | 0.16 | 0.20 | 0.52 |
| Recruits (m2) | 0.32 | 0.42 | 0.51 | 0.90 |
| Inc. survival (m2) | 2.34 | 2.52 | 3.31 | 4.28 |
| Loss rate (%.year-1) | 2.41 | 2.45 | 1.63 | 2.52 |
| Gain rate (%.year-1) | 3.68 | 3.84 | 2.74 | 3.63 |
| Turnover rate (%.year-1) | 3.05 | 3.14 | 2.19 | 3.08 |
| Net change rate (%.year-1) | 1.04 | 1.17 | 1.02 | 0.86 |
In stand C, the number of individuals increased in the first interval (2001 to 2006) and decreased in the second (2006 to 2011). Basal area increased in both intervals (Table
Tree Dynamics per diameter classes
Stand B showed higher total outgrowth (2005 to 2011: p = < 0.0001, Table
Dynamics of diameter classes of the tree component of stands B in a semi-deciduous forest in the Parque Ecológico Quedas do Rio Bonito, surveyed in the years 2000, 2005 and 2011. In the first line of the bale the captions mean: DBH (diameter at breast height); N: total number of individuals per class; D: number of dead trees per class; R: number of recruits per class and I (ingrowth) and O (outgrowth) are based on their absolute numbers; C. Poisson: Poisson counting comparing statistically ingrowth and outgrowth. In the second line of the table the captions mean: exp: expected frequency of the number of dead trees in each interval; % year-1: annual mean rate of mortality; N: Number of individuals per each category (D, O, R and I) and P: p-value of significance to Poisson Counting.
|
DBH |
N |
D |
O |
R |
I |
C. Poisson |
|||||
|
(cm) |
2000 |
2005 |
exp. |
N |
exp. |
% year-1 |
N |
N |
N |
Z |
P |
|
≥05-10 |
867 |
789 |
834.583 |
133 |
128.027 |
3.27 |
73 |
125 |
3 |
4.29 |
<0.0001 |
|
>10-20 |
415 |
427 |
399.483 |
30 |
28.878 |
1.48 |
31 |
- |
73 |
1.03 |
0.3008 |
|
>20-40 |
77 |
94 |
74.121 |
11 |
10.589 |
3.03 |
- |
- |
28 |
2.76 |
0.0057 |
|
>40-80 |
5 |
3 |
4.813 |
2 |
1.925 |
9.71 |
- |
- |
- |
1.31 |
0.1890 |
|
2005 |
2011 |
||||||||||
|
≥05-10 |
789 |
686 |
748.739 |
134 |
127.162 |
3.65 |
90 |
116 |
4 |
5.66 |
<0.0001 |
|
>10-20 |
427 |
455 |
405.211 |
39 |
37.010 |
1.89 |
26 |
7 |
1 |
7.34 |
<0.0001 |
|
>20-40 |
94 |
101 |
89.203 |
14 |
13.286 |
3.17 |
2 |
- |
22 |
0.96 |
0.3337 |
|
>40-80 |
3 |
4 |
2.847 |
0 |
0 |
- |
- |
- |
1 |
0.79 |
0.4282 |
A progressive decrease of abundance in stand C was observed between 2001 and 2011 in the 5-10 cm class (Table
Dynamics of diameter classes of the tree component of stand C in a semi-deciduous forest in the Parque Ecológico Quedas do Rio Bonito, surveyed in the years 2001, 2006 and 2011. In the first line of the bale the captions mean: DBH (diameter at breast height); N: total number of individuals per class; D: number of dead trees per class; R: number of recruits per class and I (ingrowth) and O (outgrowth) are based on their absolute numbers; C. Poisson: Poisson counting comparing statistically ingrowth and outgrowth. In the second line of the table the captions mean: exp: expected frequency of the number of dead trees in each interval; % year-1: annual mean rate of mortality; N: Number of individuals per each category (D, O, R and I) and P: p-value of significance to Poisson Counting.
|
DBH |
N |
D |
O |
R |
I |
C. Poisson |
|||||
|
(cm) |
2001 |
2006 |
exp. |
N |
exp. |
% year-1 |
N |
N |
N |
Z |
P |
|
≥05-10 |
1103 |
1091 |
1113.229 |
111 |
112.029 |
2.09 |
92 |
200 |
2 |
11.41 |
<0.0001 |
|
>10-20 |
612 |
625 |
617.675 |
45 |
45.417 |
1.51 |
34 |
- |
2 |
10.42 |
<0.0001 |
|
>20-40 |
213 |
229 |
214.975 |
13 |
13.121 |
1.25 |
5 |
- |
34 |
2.22 |
0.0258 |
|
>40-80 |
13 |
14 |
13.121 |
2 |
2.019 |
3.28 |
- |
- |
3 |
0.41 |
0.6755 |
|
2006 |
2011 |
||||||||||
|
≥05-10 |
1091 |
936 |
993.54 |
233 |
212.186 |
4.53 |
93 |
167 |
12 |
6.6 |
<0.0001 |
|
>10-20 |
625 |
585 |
569.168 |
86 |
78.318 |
2.91 |
43 |
- |
98 |
2.05 |
0.0395 |
|
>20-40 |
229 |
245 |
208.543 |
19 |
17.303 |
1.71 |
11 |
- |
43 |
1.51 |
0.1256 |
|
>40-80 |
14 |
18 |
12.749 |
1 |
0.911 |
1.47 |
1 |
- |
5 |
1.09 |
0.2717 |
Dynamics of the most abundant species
Among the 10 most abundant species in stand B (Table
Dynamics of tree populations most abundant in the forest of the Parque Ecológico Quedas do Rio Bonito, municipality of Lavras, South of Minas Gerais State, Southeast Brazil. RG = regeneration guilds (following:
|
Species |
Family |
RG |
N° trees |
Rates |
Basal area |
|||||||
| N1 | N2 | N3 | D1 | D2 | R1 | R2 | BA1 | BA2 | BA3 | |||
| Amaioua intermedia Mart. Ex Schult. & Schult.f. 1 | Rubiaceae | Sb | 112 | 121 | 136 | 0.90 | 0.50 | 2.42 | 2.79 | 0.65 | 0.83 | 1.04 |
| Copaifera langsdorffii var. krukovii Dwyer 1 | Fabaceae | Sb | 89 | 89 | 90 | 0.68 | 0.68 | 0.68 | 0.67 | 1.28 | 1.39 | 1.47 |
| Croton echinocarpus Müll. Arg. 1 | Euphorbiaceae | Pion. | 31 | 28 | 31 | 3.45 | 4.70 | 1.47 | 6.62 | 0.42 | 0.50 | 0.51 |
| Faramea latifolia (Cham. & Schltdl.) DC. 1 | Rubiaceae | St | 36 | 36 | 34 | 1.13 | 1.72 | 1.13 | 0.59 | 0.37 | 0.40 | 0.39 |
| Myrsine umbellata Mart. 1 | Primulaceae | St | 36 | 30 | 21 | 4.90 | 7.78 | 1.37 | 0.97 | 0.23 | 0.22 | 0.15 |
| Pera glabrata (Schott) Poepp. Ex Baill. 1 | Peraceae | Ld | 61 | 64 | 65 | 0.66 | 0.63 | 1.61 | 0.94 | 1.25 | 1.51 | 1.69 |
| Protium widgrenii Engl. 1 |
Burseraceae | Ld | 68 | 67 | 67 | 0.89 | 1.53 | 0.60 | 1.53 | 0.67 | 0.74 | 0.81 |
| Psychotria vellosiana Benth. 1 | Rubiaceae | Ld | 62 | 46 | 29 | 18.7 | 16.2 | 13.7 | 7.16 | 0.19 | 0.14 | 0.09 |
| Siphoneugena densiflora O. Berg 1 | Myrtaceae | St | 80 | 75 | 75 | 1.81 | 2.23 | 0.53 | 2.23 | 0.39 | 0.42 | 0.47 |
| Tapirira obtusa (Benth.) J.D.Mitch. 1 | Anacardiaceae | Ld | 67 | 64 | 52 | 2.18 | 5.20 | 1.28 | 1.18 | 0.80 | 0.87 | 0.76 |
| Cupania zanthoxyloides Cambess. 2 | Sapindaceae | Ld | 40 | 42 | 40 | 2.63 | 2.50 | 3.58 | 1.54 | 0.24 | 0.24 | 0.27 |
| Eremanthus erythropappus (DC.) MacLeish 2 | Asteraceae | - | 41 | 42 | 25 | 2.56 | 10.5 | 3.03 | 0 | 0.42 | 0.45 | 0.39 |
| Eugenia acutata Miq. 2 | Myrtaceae | St | 54 | 56 | 57 | 0.75 | 0.35 | 1.47 | 0.71 | 0.52 | 0.59 | 0.65 |
| Miconia sellowiana Naudin 2 | Melastomataceae | Ld | 110 | 114 | 67 | 2.08 | 12 | 2.78 | 2.18 | 0.90 | 0.78 | 0.58 |
| Myrcia splendens: (Sw.) DC. 2 | Myrtaceae | Ld | 99 | 100 | 51 | 3.00 | 14.7 | 3.19 | 1.20 | 0.67 | 0.65 | 0.32 |
| Prunus myrtifolia (L.) Urb. 2 | Rosaceae | Ld | 51 | 49 | 49 | 3.35 | 3.97 | 2.57 | 3.97 | 0.65 | 0.33 | 0.62 |
| Rudgea jasminoides (Cham.) Müll. Arg. 2 | Rubiaceae | St | 42 | 49 | 52 | 3.58 | 2.57 | 6.50 | 3.72 | 0.21 | 0.25 | 0.28 |
| Siphoneugena densiflora O. Berg 2 | Myrtaceae | St | 53 | 60 | 59 | 0.38 | 3.19 | 2.82 | 1.03 | 0.86 | 0.98 | 1.11 |
| Tapirira obtusa (Benth.) J.D.Mitch. 2 | Anacardiaceae | Ld | 95 | 98 | 95 | 1.29 | 2.12 | 1.90 | 1.51 | 1.27 | 1.45 | 1.56 |
| Vochysia magnífica Warm. 2 | Vochysiaceae | Ld | 98 | 89 | 79 | 1.90 | 2.35 | 0 | 0 | 1.61 | 1.86 | 2.34 |
Of particular interest were the light-demanding species in stand B, specifically Croton echinocarpus, Psychotria vellosiana, Pera glabrata and Tapirira obtusa. Psychotria. vellosiana showed higher rates of mortality than recruitment in both intervals (2005: Z = 2.0040. P = 0.04; 2011: Z = 3.06. P = 0.0021). Its turnover rate in number of individuals was higher between 2000 and 2005 equating to 16.20 % year-1. Conversely, P. glabrata exhibited a progressive accumulation of biomass (basal area) from to 2000 to 2011, presenting higher turnover in basal area in 2011 (2.31 % year-1). Tapirira obtusa showed an increased mortality as recruitment decreased (Z = 2.89. P = 0.03; Z = 2.94. P = 0.03) in both periods. Having presented neither significant mortality nor recruitment rates, the pioneer species C. echinocarpus did not change significantly in abundance after the survey in 2000. The light-demanding species in stand C, Miconia sellowiana, Myrcia splendens and Vochysia magnifica, presented significant differences in the number of mortalities or recruitments. The first two were notable for high rates of mortality in 2011 (Z = 6.58. P = <0.0001 e Z = 7.92. P = <0.0001 respectively), whereas V. magnifica did not present recruitment and showed significant mortality in both intervals (2006: Z = 3.46. P = 0.0005 and 2011: Z = 3.68. P = 0.0002).
Eremanthus erythropappus also did not present recruitment in the second interval (between 2006 and 2011), in conjunction with higher rates of mortality (Z = 5.19. P = <0.0001) and only remained among the most abundant species in 2001. The shade tolerant E. acutata e R. jasminoides increased in basal area and abundance in both intervals (Table
Usage rights
Data resources
Occurrences, basal area and diameter at breast height of 1731 trees and treelets identified during three census distributed within 26 plots within stand B in the Parque Ecológico Quedas de Rio Bonito, Lavras, Minas Gerais, Brazil. Dataset consists of occurrence.txt (DwC-Attributes id, modified, language, rights, rightsHolder, bibliographicCitation, references, datasetName, basisOfRecord, occurrenceRemarks, eventDate, decimalLatitude, decimalLongitude, acceptedNameUsageID, parentNameUsageID, nameAccordingToID, scientificName, acceptedNameUsage, parentNameUsage, nameAccordingTo, higherClassification, kingdom, class, order, family, genus, subgenus, specificEpithet, infraSpecificEpithet, taxonRank, scientificNameAuthorship, nomenclaturalCode, taxonomicStatus), meta.xml, measurementOrFact.txt (continaining the DwC-Attributes id, measurementType, measurementUnit, measurementMethod, measurementValue, measurementRemarks), eml.xml, description.txt (containing the DwC-Attributes id, description, type, language). Please see http://rs.tdwg.org/dwc/ for details.
| Column label | Column description |
|---|---|
| id | Occurrence identifier |
| modified | The most recent date-time on which the resource was changed. |
| rights | Information about who can access the resource or an indication of its security status. |
| rightsHolder | A person or organization owning or managing rights over the resource. |
| bibliographicCitation | A bibliographic reference for the resource as a statement indicating how this record should be cited (attributed) when used. |
| reference | A related resource that is referenced, cited, or otherwise pointed to by the described resource. |
| datasetName | The name identifying the data set from which the record was derived. |
| basisOfRecord | The specific nature of the data record. |
| eventDate | The date-time or interval during which an Event occurred. For occurrences, this is the date-time when the event was recorded. |
| decimalLatitude | The geographic latitude (in decimal degrees, using the spatial reference system given in geodeticDatum) of the geographic center of a Location. |
| decimalLongitude | The geographic longitude (in decimal degrees, using the spatial reference system given in geodeticDatum) of the geographic center of a Location. |
| acceptedNameUsageID | An identifier for the name usage (documented meaning of the name according to a source) of the currently valid (zoological) or accepted (botanical) taxon. |
| parentNameUsageID | An identifier for the name usage (documented meaning of the name according to a source) of the direct, most proximate higher-rank parent taxon (in a classification) of the most specific element of the scientificName. |
| nameAccordingToID | An identifier for the source in which the specific taxon concept circumscription is defined or implied. |
| scientificName | The full scientific name, with authorship and date information if known. When forming part of an Identification, this should be the name in lowest level taxonomic rank that can be determined. |
| acceptedNameUsage | The full name, with authorship and date information if known, of the currently valid (zoological) or accepted (botanical) taxon. |
| parentNameUsage | The full name, with authorship and date information if known, of the direct, most proximate higher-rank parent taxon (in a classification) of the most specific element of the scientificName. |
| nameAccordingTo | The reference to the source in which the specific taxon concept circumscription is defined or implied - traditionally signified by the Latin "sensu" or "sec." (from secundum, meaning "according to"). For taxa that result from identifications, a reference to the keys, monographs, experts and other sources should be given. |
| higherClassification | A list (concatenated and separated) of taxa names terminating at the rank immediately superior to the taxon referenced in the taxon record. |
| kingdom | The full scientific name of the kingdom in which the taxon is classified. |
| class | The full scientific name of the class in which the taxon is classified. |
| order | The full scientific name of the order in which the taxon is classified. |
| family | The full scientific name of the family in which the taxon is classified. |
| genus | The full scientific name of the genus in which the taxon is classified. |
| subgenus | The full scientific name of the subgenus in which the taxon is classified. |
| specificEpithet | The name of the first or species epithet of the scientificName. |
| intraspecificEpithet | The name of the lowest or terminal infraspecific epithet of the scientificName, excluding any rank designation. |
| taxonRank | The taxonomic rank of the most specific name in the scientificName. |
| scientificNameAutorship | The authorship information for the scientificName formatted according to the conventions of the applicable nomenclaturalCode. |
| nomenclaturalCode | The nomenclatural code (or codes in the case of an ambiregnal name) under which the scientificName is constructed. Recommended best practice is to use a controlled vocabulary. |
| taxonomicStatus | The status of the use of the scientificName as a label for a taxon. |
| description | Habitat Type |
| type | The nature or genre of the resource. |
| measurementType | The nature of the measurement, fact, characteristic, or assertion. |
| measurementValue | The units associated with the measurementValue. |
| measurementUnit | The units associated with the measurementValue. |
| measurementMethod | A description of or reference to (publication, URI) the method or protocol used to determine the measurement, fact, characteristic, or assertion. |
| measurementRemarks | Comments or notes accompanying the MeasurementOrFact. |
| language | A language of the resource. |
| occurrenceRemarks | Comments or notes about the Occurrence. |
Occurrences, basal area and diameter at breast height of 1970 trees and treelets identified during three census distributed within 38 plots within stand C in the Parque Ecológico Quedas de Rio Bonito, Lavras, Minas Gerais, Brazil. Dataset consists of occurrence.txt (DwC-Attributes id, modified, language, rights, rightsHolder, bibliographicCitation, references, datasetName, basisOfRecord, occurrenceRemarks, eventDate, decimalLatitude, decimalLongitude, acceptedNameUsageID, parentNameUsageID, nameAccordingToID, scientificName, acceptedNameUsage, parentNameUsage, nameAccordingTo, higherClassification, kingdom, class, order, family, genus, subgenus, specificEpithet, infraSpecificEpithet, taxonRank, scientificNameAuthorship, nomenclaturalCode, taxonomicStatus), meta.xml, measurementOrFact.txt (continaining the DwC-Attributes id, measurementType, measurementUnit, measurementMethod, measurementValue, measurementRemarks), eml.xml, description.txt (containing the DwC-Attributes id, description, type, language). Please see http://rs.tdwg.org/dwc/ for details.
| Column label | Column description |
|---|---|
| id | Occurrence identifier |
| modified | The most recent date-time on which the resource was changed. |
| rights | A legal document giving official permission to do something with the resource. |
| rightsHolder | A person or organization owning or managing rights over the resource. |
| bibliographicCitation | A bibliographic reference for the resource as a statement indicating how this record should be cited (attributed) when used. |
| reference | A related resource that is referenced, cited, or otherwise pointed to by the described resource. |
| datasetName | The name identifying the data set from which the record was derived. |
| basisOfRecords | The specific nature of the data record. |
| occurrenceRemarks | Comments or notes about the Occurrence. |
| eventDate | The date-time or interval during which an Event occurred. For occurrences, this is the date-time when the event was recorded. |
| decimalLatitude | The geographic latitude (in decimal degrees, using the spatial reference system given in geodeticDatum) of the geographic center of a Location. |
| decimalLongitude | The geographic longitude (in decimal degrees, using the spatial reference system given in geodeticDatum) of the geographic center of a Location. |
| acceptedNameUsageID | An identifier for the name usage (documented meaning of the name according to a source) of the accepted taxon. |
| parentNameUsageID | An identifier for the name usage (documented meaning of the name according to a source) of the direct, most proximate higher-rank parent taxon (in a classification) of the most specific element of the scientificName. |
| nameAccordingToID | An identifier for the source in which the specific taxon concept circumscription is defined or implied. |
| scientificName | The full scientific name, with authorship and date information if known. When forming part of an Identification, this is the name in lowest level taxonomic rank that can be determined. This term does not contain identification qualifications. |
| acceptedNameUsage | The full name, with authorship and date information if known, of the accepted botanical taxon. |
| parentNameUsage | The full name, with authorship and date information if known, of the direct, most proximate higher-rank parent taxon of the most specific element of the scientificName. |
| nameAccordingTo | The reference to the source in which the specific taxon concept circumscription is defined or implied. |
| higherClassification | A list (concatenated and separated) of taxa names terminating at the rank immediately superior to the taxon referenced in the taxon record. |
| kingdom | The full scientific name of the kingdom in which the taxon is classified. |
| class | The full scientific name of the class in which the taxon is classified. |
| order | The full scientific name of the order in which the taxon is classified. |
| family | The full scientific name of the family in which the taxon is classified. |
| genus | The full scientific name of the genus in which the taxon is classified. |
| subgenus | The full scientific name of the subgenus in which the taxon is classified. |
| specificEpithet | The name of the first or species epithet of the scientificName. |
| intraspecificEpithet | The name of the lowest or terminal infraspecific epithet of the scientificName, excluding any rank designation. |
| taxonRank | The taxonomic rank of the most specific name in the scientificName. |
| scientificNameAuthorship | The authorship information for the scientificName formatted according to the conventions of the applicable nomenclaturalCode. |
| nomenclaturalCode | The nomenclatural code (or codes in the case of an ambiregnal name) under which the scientificName is constructed. |
| taxonomicStatus | The status of the use of the scientificName as a label for a taxon. |
| description | Habitat type |
| type | The nature or genre of the resource. For Darwin Core, recommended best practice is to use the name of the class that defines the root of the record. |
| measurementType | The value of the measurement, fact, characteristic, or assertion. |
| measurementValue | The value of the measurement, fact, characteristic, or assertion. |
| measurementValue | The units associated with the measurementValue. |
| measurementUnit | A description of or reference to (publication, URI) the method or protocol used to determine the measurement, fact, characteristic, or assertion. |
| measurementMethod | A description of or reference to (publication, URI) the method or protocol used to determine the measurement, fact, characteristic, or assertion. |
| measurementRemarks | Comments or notes accompanying the MeasurementOrFac |
Additional information
Discussion
Structure, diversity and species richness
The diversity observed in stand C is amongst the highest observed in the region of this study (
On the other hand, the demonstrated reduction in values of species diversity and richness from 2000 to 2011 in stand B, concurrent with its decrease in evenness from 2005 to 2011 (Table
Tree dynamics
The prevalence of basal area accumulation, in conjunction with reduction of abundance in stands B (in both intervals) and C (just in the first interval), gives rise to a mature forest. This is indicative of an advanced successional stage in both stands of the studied forest (
The transition of dynamic patterns observed in stand C (1° survey: simultaneous increase of abundance and basal area; 2° survey: increase of basal area and decrease of abundance) is possibly caused by gap formation (
The location of the stands in two different locations within the forest in PQERB can be also considered relevant as an explanatory factor for the observed rates of mortality and recruitment, because these stands encompass various ecological units of vegetation with distinct ages of formation, leading to a heterogeneous forest with multiple successional stages (
Tree Dynamics per diameter classes
The J-inverted distribution of individuals per diameter class is typical of many tropical forests and has been reported to be the case in other forests in the region of the studied site (
Dynamics of the most abundant species
Shade-tolerant species are able to develop under a closed canopy and require little sunlight. Conversely, the light-demanding species need higher sunlight incidence in order to develop and establish in a site. Both types of species occur in mature tropical forests in ongoing successional advance (
The importance of light-demanding and shade-tolerant species in the community is demonstrated by their progressive increase in abundance and basal area. This confirms their important role in the formation of community structure and successional advance (
General conclusions on forest dynamics and conservation
The higher diversity in stand C, plus the diversity in stand B, indicates high alpha diversity within the PEQRB forest. This highlights the importance of the protection of biotic resources, and also supports the demand for further research to understand underlying determinants of this diversity. Despite the differences found in the structural dynamics within the studied forest, the basal area increased in both stands indicating biomass accumulation. This is a key factor in ecosystem services, such as the amplification of carbon stock through biomass gain. These two points show the importance of the protection of Atlantic Forests and that studies like this are important so that we may better understand the drivers of forest dynamics. Thus, the continued monitoring of this study site is necessary to further refine the mechanisms underlying tree dynamics.
References
- An update of the Angiosperm Phylogeny Group classification for the orders and families of flowering plants: APG IV.Botanical Journal of the Linnean Society181(1):1‑20. https://doi.org/10.1111/boj.12385
- Tree population and community dynamics in a Brazilian tropical semideciduous forest.Revista Brasileira de Botânica28:347‑360. https://doi.org/10.1590/S0100-84042005000200014
- The taxonomic name resolution service: an online tool for automated.BMC Bioinformatics14:1‑16. https://doi.org/10.1186/1471-2105-14-16
- Field & laboratory methods for general ecology.3 ed.William C. Brown,Iowa. [ISBN978-0697051455]
- An Introduction to Vegetation Analysis.342.Springer,Netherlands. https://doi.org/10.1007/978-94-011-7981-2
- Composition and Dynamics of Functional Groups of Trees During Tropical Forest Succession in Northeastern Costa Rica.Biotropica42:31‑40. https://doi.org/10.1111/j.1744-7429.2009.00566.x
- Chazdon RL (2008) Chance and determinism in tropical forest succession. In: Carson WP, Schnitzer SA (Eds) Tropical forest community ecology.Wiley-Blackwell,Oxford,536pp. [ISBN978-1-4051-1897-2].
- Beta-Diversity in Tropical Forest Trees.Science295(5555):666‑669. https://doi.org/10.1126/science.1066854
- Effects of size, competition and altitude on tree growth.Journal of Ecology95(5):1084‑1097. https://doi.org/10.1111/j.1365-2745.2007.01280.x
- Flora e estrutura do componente arbóreo da floresta do Parque Ecológico Quedas do Rio Bonito, Lavras, MG, e correlações entre a distribuição das espécies e variáveis ambientais.Acta Botanica Brasilica18:737‑757. https://doi.org/10.1590/S0102-33062004000400005
- Dominance of the suppressed: Power-law size structure in tropical forests.Science351(6269):2014‑2016. https://doi.org/10.1126/science.aad0592
- Twosided Exact Tests and Matching Confidence Intervals for Discrete Data.R Journal2:53‑58. URL: https://journal.r-project.org/archive/2010-1/RJournal_2010-1_Fay.pdf
- Diversity, structure and dynamics of a gallery forest in central Brazil.Vegetatio117(1):1‑15. https://doi.org/10.1007/BF00033255
- Spatial analysis: a guide for ecologists.Cambridge University Press,380pp. [ISBN9780521009737] https://doi.org/10.1111/boj.12325
- Garcia PO (2012) Rotatividade da comunidade arbórea em fragmento de Mata Atlântica e correlações com fatores edáficos, topográficos, bióticos e ecológicos.Universidade Federal deLavras,Lavras,145pp.
- Mortality and recruitment of trees in a secondary montane rain forest in Southeastern Brazil.Brazilian Journal of Biology63(1):47‑60. https://doi.org/10.1590/S1519-69842003000100007
- Ecologia Y Conservacion De Bosques Neotropicales.Libro Universitario Regional,691pp. [ISBN9789968801119]
- Neotropical secondary forest succession: Changes in structural and functional characteristics.Forest Ecology and Management148(1):185‑206. https://doi.org/10.1016/S0378-1127(00)00535-1
- Dinâmica do componente arbustivo-arbóreo de uma floresta de galeria aluvial no planalto de Poços de Caldas, MG, Brasil.Revista Brasileira de Botânica31(4). https://doi.org/10.1590/S0100-84042008000400008
- Ecologia Vegetal.2.Artmed,592pp. [ISBN978-8536319186]
- PAST: paleontological statistics software package for education and data analysis.Palaeontologia Electronica4(1):1‑9. URL: http://palaeo-electronica.org/2001_1/past/issue1_01.htm
- The Unified Neutral Theory of iodiversity and Biogeography.Princeton University Press,392pp. [ISBN9780691021287]
- A test for comparing diversities based on the shannon formula.Journal of Theoretical Biology29(1):151‑154. https://doi.org/10.1016/0022-5193(70)90124-4
- Growth and Mortality of Trees in Amazonian Tropical Rain Forest in Ecuador.Journal of Vegetation Science5(1):77‑86. https://doi.org/10.2307/3235641
- lmerTest: Tests in Linear Mixed Effects Models. R package version 2.0-33. URL: CRAN.R-project.org/package=lmerTest
- The fate of Amazonian forest fragments: A 32year investigation.Biological Conservation144(1):56‑67. https://doi.org/10.1016/j.biocon.2010.09.021
- Phylogenetic structure of angiosperm communities during tropical forest succession.Proceedings of the Royal Society / Biological Sciences277(1678):97‑104. https://doi.org/10.1098/rspb.2009.0865
- Rapid recovey of biomass, species richness and species composition in a forest chronosequence in Northeastern Costa Rica.Biotropica41(5):608‑617. https://doi.org/10.1111/j.1744-7429.2009.00517.x
- Phylogenetic community structure during succession: Evidence from three Neotropical forest sites.Perspectives in Plant Ecology, Evolution and Systematics,14(2):79‑87. https://doi.org/10.1016/j.ppees.2011.09.005
- Mortality Patterns and Stand Turnover Rates in a Wet Tropical Forest in Costa Rica.Journal of Ecology73(3):915‑924. https://doi.org/10.2307/2260157
- Hotspots Revisited: Earth's Biologically Richest and Most Endangered Terrestrial Ecoregions.Conservation International,392pp. [ISBN9789686397772]
- Functional convergence and phylogenetic divergence during secondary succession of subtropical wet forests in Puerto Rico.Journal of Vegetation Science27(2):283‑294. https://doi.org/10.1111/jvs.12354
- vegan: Community Ecology Package.version 2.4-2. URL: https://CRAN.R-project.org/package=vegan
- Forests: elements of silvology.SpringerVerlag,624pp. [ISBN978-3-642-75213-1] https://doi.org/10.1007/978-3-642-75211-7
- Oldeman RA (1989) Dynamics in tropical rain forests. In: Holm-Nielson L, Nielsen I, Balslev H (Eds) Tropical forest: botanical dynamics, speciation and diversity.Academic Press,396pp. [ISBNISBN 9780123535504]. https://doi.org/10.1007/978-3-642-75211-7
- Ecologia da vegetação do parque florestal Quedas do Rio Bonito.Cerne5(2):51‑6.
- Diversity and structure of the tree community of a fragment of tropical secondary forest of the brazilian Atlantic Forest domain 15 and 40 years after logging.Revista Brasileira de Botânica27(4):685‑701. https://doi.org/10.1590/S0100-84042004000400009
- Dinâmica da comunidade e populações arbóreas da borda e interior de um remanescente florestal na Serra da Mantiqueira, Minas Gerais, em um intervalo de cinco anos (1999-2004).Revista Brasileira d Botânica30(1):149‑161. https://doi.org/10.1590/S0100-84042007000100015
- Effects of past disturbance and edges on tree community structure and dynamics within a fragment of tropical semideciduous forest in southeastern Brazil over a five year period (1987–1992).Plant Ecology formerly `Vegetatio'131(1):45‑66. https://doi.org/10.1023/A:1009744207641
- Environmental heterogeneity and disturbance by humans control much of the tree species diversity of Atlantic montane forest fragments in SE Brazil.Biodiversity and Conservation16(6):1761‑1784. https://doi.org/10.1007/978-1-4020-6444-9_13
- Long-term environmental change in tropical forests: increasing tree turnover.Environmental Conservation23:235‑248. https://doi.org/10.1017/S0376892900038856
- Increasing Turnover Through Time in Tropical Forests.Science263(5149):954‑958. https://doi.org/10.1126/science.263.5149.954
- Pattern and process in Amazon tree turnover, 19762001.Philosophical Transactions of the Royal Society B: Biological Sciences359(1443):381‑407. https://doi.org/10.1098/rstb.2003.1438
- A Language and Environment for Statistical Computing. R-Foundation for Statistical Computing.3.3.0.R Foundation for Statistical Computing, Vienna, Austria.. URL: https://www.R-project.org/
- How much is left, and how is the remaining forest distributed? Implications for conservation.Biological Conservation142(6):1141‑1153. https://doi.org/10.1016/j.biocon.2009.02.021
- Tree changes in a mature rainforest with high diversity and endemism on the Brazilian coast.Biodiversity and Conservation20(9):1921‑1949. https://doi.org/10.1007/s10531-011-0067-3
- Mortality and Recruitment Rate Evaluations in Heterogeneous Tropical Forests.Journal of Ecology84(1):91‑100. https://doi.org/10.2307/2261703
- The Interpretation and Misinterpretation of Mortality Rate Measures.Journal of Ecology83(2):331‑333. https://doi.org/10.2307/2261571
- Long-term permanent plot observations of vegetation dynamics in Budongo, a Ugandan rain forest.Journal of Tropical Ecology16(6):865‑852. https://doi.org/10.2307/2261571
- DescTools: Tools for descriptive statistics.R package version 0.99.17. URL: https://cran.r-project.org/web/packages/DescTools/DescTools.pdf
- Dinâmica de uma comunidade arbórea após enchente em fragmentos florestais no sul de Minas Gerais.Revista Árvore35(4):883-‑893. https://doi.org/10.1590/S0100-67622011000500014
- Forest turnover rates follow global and regional patterns of productivity.Ecology Letters8(5):524‑531. https://doi.org/10.1111/j.1461-0248.2005.00746.x
- On the definition of ecological species groups in tropical rain forests.Vegetatio75(1/2):81‑86. https://doi.org/10.1007/bf00044629
- The dynamics of tree populations in tropical forest: a review.Journal of Tropical Ecology3(4):359‑366. https://doi.org/10.1017/s0266467400002339
- Interactions among plants and evolution.Journal of Ecology99(3):729‑740. https://doi.org/10.1111/j.1365-2745.2011.01802.x
- Asymmetric competition in plant populations.Trends in Ecology and Evolution,5(11):360‑364. https://doi.org/10.1016/0169-5347(90)90095-U
- Whitmore TC (1988) The influence of tree population dynamics on forest species composition. In: Davy AJ, Hutchings MJ, Watkinson AR (Eds) Population biology of plants.Blackwell Scientific Publications,478pp. [ISBN0-632-02349-X]. https://doi.org/10.1017/S0266467400004417
- Biostatistical analysis.5.Pearson,New Jersey,944pp. [ISBN978-0321656865]