|
Biodiversity Data Journal :
Taxonomic Paper
|
|
Corresponding author: Nina Filippova (filippova.courlee.nina@gmail.com)
Academic editor: Dmitry Schigel
Received: 31 Aug 2017 | Accepted: 18 Dec 2017 | Published: 29 Dec 2017
© 2017 Nina Filippova, Tatiana Bulyonkova
This is an open access article distributed under the terms of the Creative Commons Attribution License (CC BY 4.0), which permits unrestricted use, distribution, and reproduction in any medium, provided the original author and source are credited.
Citation:
Filippova N, Bulyonkova T (2017) The communities of terrestrial macrofungi in different forest types in vicinities of Khanty-Mansiysk (middle taiga zone of West Siberia). Biodiversity Data Journal 5: e20732. https://doi.org/10.3897/BDJ.5.e20732
|
|
Abstract
Background
The diversity of macrofungi in the vicinities of Khanty-Mansiysk (Yugra, Russia) was surveyed using a method of permanent sampling plots. Ten plots, each consisting of a number of micro-plots, were established in several different communities ranging from old-growth mixed taiga forest to its derivatives in cutting succession and bogged areas. For more complete registration of the mycota, plots were supplemented with random walking routes directly nearby. Survey results were subjected to various quantitative analyses which allowed not only to evaluate the diversity of fungi but also to obtain valuable information on occurrence, abundance and ecology of individual species as well as community structure and its dynamics in the course of ecological succession. The paper reports the results of the first year of observations.
New information
460 species of terrestrial macrofungi revealed in a poorly explored area in middle taiga of West Siberia. The plot-based study revealed differences between communities of terrestrial macrofungi of old coniferous forests, their after-cutting secondary formations and bogged stages. The survey allowed to reveal records of 3 species listed in the Red Data Book of Russia and 9 species listed in the Red Data Book of Yugra.
Keywords
biodiversity, macrofungi, funga, boreal forest, West Siberia
Introduction
Terrestrial macrofungi are a crucial component of boreal forest ecosystems playing several significant roles, the most notable being their saprotrophic function and mycorrhizal symbiosis with trees. Basidial macromycetes are the key decomposers of highly recalcitrant coniferous litter; as mycorrhizal partners of trees, they enable the survival of the forest in harsh conditions of the north. The species diversity of terrestrial macrofungi may be several times higher compared to that of plants in coniferous forests and the biomass of mycelium in forest floor is comparable to that of the forest undergrowth (
Conifers cover vast areas of boreal zone of West Siberia. Low human population density and historical factors have helped to preserve relatively intact massive areas of zonal coniferous forests there. At the same time, the region has always been under-studied mycologically, with most of the research concentrated around large urban scientific centres, notably in Tomsk, Novosibirsk and Yekaterinburg. The region does not have a comprehensive analogue of “Funga Nordica” (Knudsen and Vesterholt 2008); existing checklists are few and only cover fragments of the whole territory with a varying degree of fullness.
While surveying species diversity remains the top priority for our region, it is believed that plot-based studies of fungal communities can yield additional valuable information about the ecology of individual species and about community structure. Thereby, a series of permanent plots for observations of terrestrial macrofungi was laid out in different forest types in the vicinities of Khanty-Mansiysk in the spring of 2015. This paper reports the results of the first year of observations. Although the manpower was limited (only one person was employed on the plots during vegetation season), it is believed that the results can be considered as representative for the surrounding area.
Materials and methods
Site description
The studied area is located in the middle taiga zone of West Siberia. The climate is continental subarctic according to the Köppen climate classification. The average annual temperature is –1.3 °C, the mean temperature of the coldest month (January) –19.8 °C, the warmest month is July with its average of 18 °C (
For the purpose of permanent monitoring, an area located 20 km from the Khanty-Mansiysk town was chosen which is at the same time situated within the borders of the natural park «Samarovskiy Chugas» and is relatively intact (Fig.
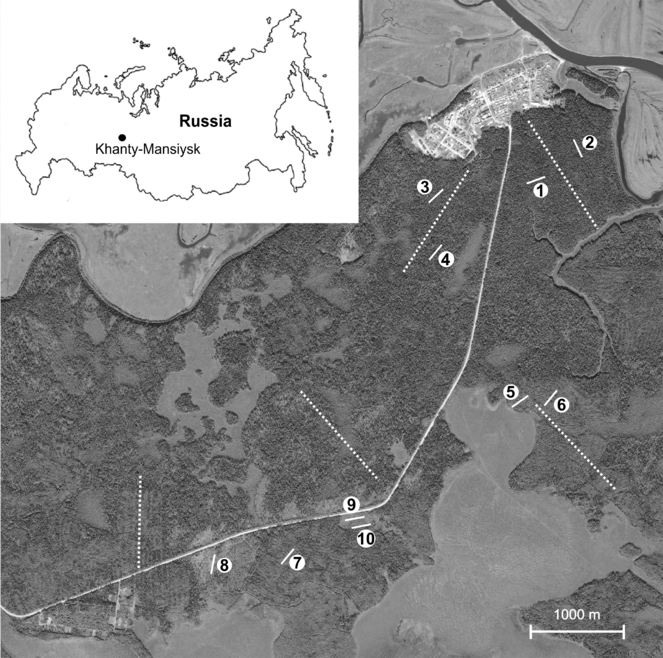
Plots 1-4 represent old coniferous forests with dominance of P. sibirica with some P. obovata and a smaller proportion of A. sibirica. Plots 5-7 are located in an old cutting site and represent secondary aspen forests. P. tremula dominates in the community with an admixture of B. pendula and regrowth of coniferous trees. Plot 8 represents a fresh cutting site where clear-cut was about 5 years ago. The tree layer is absent except for isolated surviving trees (P. sibirica, A. sibirica, P. obovata) and the regrowth made by P. tremula. Plot 9 is located in a small in size bogged locality with waterlogged soil (peat) and residual falling trees. Presumably a fire could have had some impact in the past. Plot 10 is located in proximity to plot 9 on a relatively drier position occupied by wet birch forest. The description of vegetation and geo-reference position of the plots are summarised in Table
Characteristics of permanent plots of macromycetes observations in different forest types in vicinities of Khanty-Mansiysk, West Siberia.
|
Plot No. |
Coordinate |
Vegetation type |
Time after cut, years |
Trees height and % cover |
Plants % cover |
Mosses % cover |
T, °C for May-September |
Total number of plant species |
Dominant plants (only species with >5 % of cover shown) |
|
1 |
|
Coniferous mixed forest |
- |
18-20 m 80% |
15 |
70 |
Av 11,7 Min 2.3 Max 23 |
26 |
Pinus sibirica, Abies sibirica, Betula pubescens, Picea obovata, Vaccinium myrtillus, Hylocomium splendens, Pleurozium schreberi, Polytrichum commune |
|
2 |
|
Coniferous mixed forest |
- |
20-22 m 70% |
25 |
70 |
22 |
Pinus sibirica, Abies sibirica, Pinus sylvestris, Picea obovata, Vaccinium myrtillus, Linnaea borealis, Hylocomium splendens, Pleurozium schreberi, Polytrichum commune |
|
|
3 |
|
Coniferous mixed forest |
- |
18-20 m 80% |
15 |
60 |
26 |
Pinus sibirica, Abies sibirica, Picea obovata, Populus tremula, Vaccinium myrtillus, Hylocomium splendens, Pleurozium schreberi |
|
|
4 |
|
Coniferous mixed forest |
- |
18-20 m 70% |
15 |
75 |
24 |
Pinus sibirica, Picea obovata, Abies sibirica, Populus tremula, Linnaea borealis, Hylocomium splendens, Pleurozium schreberi, Polytrichum commune |
|
|
5 |
|
Aspen forest |
25-30 |
14-16 m 60% |
15 |
3 |
- |
30 |
Pinus sibirica, Picea obovata, Abies sibirica, Populus tremula, Gymnocarpium dryopteris |
|
6 |
|
Aspen forest |
25-30 |
16-18 m 70% |
25 |
5 |
31 |
Populus tremula, Betula pubescens, Pinus sibirica, Vaccinium vitis-idaea, Equisetum sylvaticum |
|
|
7 |
|
Aspen forest |
20-25 |
14-15 m 70% |
15 |
10 |
Av 12.2 Min 1.9 Max 30 |
33 |
Populus tremula, Betula pubescens, Polytrichum commune, Pleurozium schreberi |
|
8 |
|
Fresh cutting site |
5 |
1-3 m 30% |
40 |
5 |
Av 12,4 Min -2,4 Max 32,9 |
37 |
Populus tremula, Gymnocarpium dryopteris, Vaccinium vitis-idaea, Equisetum sylvaticum, Calamagrostis canescens |
|
9 |
|
Bogged site |
- |
3-4 m 30% |
40 |
90 |
Av 13,4 Min -0,6 Max 36,8 |
22 |
Betula pubescens, Carex globularis, Carex lasiocarpa, Calamagrostis purpurea, Sphagnum angustifolium, Polytrichum strictum |
|
10 |
|
Birch forest |
- |
8-10 m 80% |
8 |
80 |
Av 11,9 Min -0,4 Max 26,4 |
27 |
Betula pubescens, Vaccinium vitis-idaea, Polytrichum commune, Pleurozium schreberi, Polytrichum juniperinum |
Sampling design
Ten permanent plots were established in spring 2015 distributed over an area of about 10 square kilometres Fig.
Each plot consisted of 20 circular 5 m2 micro-plots 5 m apart aligned in a 200 m long line. The observation area of a plot thus equals 100 m2 and the total area of plot-observation during the survey was 1000 m2. Centres of each micro-plot were marked by plastic poles. A rope was used to draw the outlines of a plot during its examination. The total number of fruiting bodies of each species was counted on each micro-plot. Counted fruitbodies were removed in order to avoid repeated count in the following visits. A few species, where the counting would be impossible due to their high abundance, were counted by estimated number. Some species with densely clustered growth were counted by number of clusters (e.g. Collybia cirrhata). In addition to plots observation, walking routes designed to find species not registered in plots (rare species or species with special requirements for environmental conditions) were used. For this, the authors walked along a straight line (using GPS) and collected only new species. No quantitative count was done at this stage. The length of the routes ranged between 500 m to 2 km depending on the abundance of fruiting or weather conditions.
The plots were visited from the end of May (soon after snow melt) until the middle of September (when fungal fruiting was suppressed by the first frosts). The time interval between subsequent visits of each plot ranged between 14-23 days, resulting in total of 5 visits per plot and 5 visits per random route during the season (one visit per month).
The temperature regime of the plots was measured by temperature loggers located in 5 plots of different vegetation types at 5 cm above soil level (Thermochron loggers DS1921G-F5).
Processing of specimens, identification and analysis of trophic groups
The collection and processing of specimens was done as described in
The detailed identification was done during the winter following the collection season. Dry specimens were rehydrated in tap water or KOH (10%); dyes and other chemicals (Congo Red, Melzer reagent, ammonia) were applied when necessary. A Zeiss Axiostar microscope with Achromat 5/0.12, 10/0.25, 40/0.65 (dry) and 100/1.25 (oil immersion) objectives was used for microscopical examination. Мicro-photographs were taken with an AxioCam ERc5s digital camera.
Most of the finds were identified using Funga Nordica keys (
The trophic groups of species were determined from literature (
Statistical analyses
Statistical analyses were performed using EstimateS (
Accepted definitions
Terrestrial macrofungi – the macrofungi which confine to terrestrial habitat as opposed to wood-inhabiting species representing another prominent community in boreal forests. However, these groups partially overlap and species were recorded growing on mossy old trunks or buried wood within the plots. This study included the following groups in the analysis: Discomycetes, agaricoid members of Agaricales and Boletales and club-like members of Aphyllophorales (following defenitions in
Sporocarp density – number of sporocarps of macrofungi produced in a certain area. The accumulated sporocarp density, calculated as sum of densities of all visits, was used, as well as sporocarps density per visit when discussing phenology.
Species abundance – number of micro-plots where species was registered within a plot. The sum values were calculated for each plot based on all visits. This criterion was selected for statistical analyses to align the species that fruit in density with those with scattered fruiting, thus each micro-plot corresponded to a genet of a particular species.
Species occurrence – number of plots where the species was registered (maximum – 10 plots).
Species richness – number of species registered in a particular plot.
Data resources
The collection database was imported to Specify 6 (offline) and Specify 7 (available at https://fungariumysu.org/fungarium-ysu-database) software. The plot-based observation database (as Sampling Event Dataset) was uploaded to GBIF and could be available from the page (http://www.gbif.org/dataset/7648036d-fdac-4ebe-8861-9a28134adae1) (
The total species list of terrestrial macrofungi in different forest types in vicinities of Khanty-Mansiysk (including species encountered in plots and during walking routes)
Agaricus semotus
Agrocybe elatella
Agrocybe firma
Alloclavaria purpurea
Amanita battarae
Amanita crocea
Amanita fulva
Amanita porphyria
Amanita regalis
Amanita vaginata var. alba
Ampulloclitocybe clavipes
Armillaria lutea
Arrhenia acerosa
Arrhenia discorosea
Arrhenia epichysium
Arrhenia onisca
Artomyces pyxidatus
Asterophora lycoperdoides
Auriscalpium vulgare
Baeospora myriadophylla
Bolbitius titubans
Boletus edulis
Boletus subtomentosus
Calocera cornea
Calocera viscosa
Calocybe gambosa
Cantharellus cibarius
Chalciporus piperatus
Chroogomphus rutilus
Ciboria betulicola
Ciboria caucus
Clavaria flavipes
Clavariadelphus truncatus
Clavulina coralloides
Clavulinopsis laeticolor
Clavulinopsis luteoalba
Clavulinopsis umbrinella
Clitocybe agrestis
Clitocybe albofragrans
Clitocybe amarescens
Clitocybe candicans
Clitocybe diatreta
Clitocybe diosma
Clitocybe foetens
Clitocybe globispora
Clitocybe metachroa
Clitocybe nebularis
Clitocybe odora
Clitocybe regularis
Clitocybe subspadicea
Clitocybe vermicularis
Clitocybe vibecina
Clitopilus prunulus
Collybia cirrhata
Collybia cookei
Collybia tuberosa
Coltricia perennis
Conocybe apala
Conocybe aurea
Conocybe filipes
Conocybe merdaria
Conocybe mesospora
Conocybe semiglobata
Cordyceps militaris
Cortinarius acutus
Cortinarius agathosmus
Cortinarius alborufescens
Cortinarius albovariegatus
Cortinarius alboviolaceus
Cortinarius anomalus
Cortinarius argutus
Cortinarius armeniacus
Cortinarius armillatus
Cortinarius aurantiomarginatus
Cortinarius balaustinus
Cortinarius bataillei
Cortinarius biformis
Cortinarius bivelus
Cortinarius bolaris
Cortinarius brunneus
Cortinarius camphoratus
Cortinarius carbunculus
Cortinarius casimiri
Cortinarius cicindela
Cortinarius cinnamomeus
Cortinarius collinitus
Cortinarius comptulus
Cortinarius craticius
Cortinarius croceus
Cortinarius decipiens
Cortinarius delibutus
Cortinarius depressus
Cortinarius diasemospermus
Cortinarius disjungendus
Cortinarius dolabratus
Cortinarius duracinus
Cortinarius evernius
Cortinarius flexipes
Cortinarius fusisporus
Cortinarius gentilis
Cortinarius glandicolor
Cortinarius illuminus
Cortinarius laniger
Cortinarius lepidopus
Cortinarius lux-nymphae
Cortinarius melleopallens
Cortinarius multiformis
Cortinarius obtusus
Cortinarius ochrophyllus
Cortinarius paragaudis
Cortinarius parvannulatus
Cortinarius pholideus
Cortinarius phrygianus
Cortinarius pilatii
Cortinarius porphyropus
Cortinarius praestigiosus
Cortinarius raphanoides
Cortinarius sanguineus
Cortinarius saturninus
Cortinarius scaurus
Cortinarius semisanguineus
Cortinarius septentrionalis
Cortinarius spilomeus
Cortinarius talus
Cortinarius tortuosus
Cortinarius traganus
Cortinarius trivialis
Cortinarius tubarius
Cortinarius umbrinolens
Cortinarius venustus
Cortinarius vernus
Cortinarius vibratilis
Cortinarius violaceus
Crepidotus cesatii
Crepidotus epibryus
Crepidotus mollis
Cudonia circinans
Cuphophyllus virgineus
Cystoderma amianthinum
Cystoderma carcharias var. fallax
Cystoderma jasonis
Cystodermella adnatifolia
Cystodermella cinnabarina
Cystodermella granulosa var. granulosa
Cystolepiota seminuda
Dendrocollybia racemosa
Elaphomyces asperulus
Entoloma allospermum
Entoloma cetratum
Entoloma conferendum
Entoloma depluens
Entoloma lampropus
Entoloma lanuginosipes
Entoloma myrmecophilum
Entoloma nitens
Entoloma rhodopolium var. pseudopolitum
Entoloma rusticoides
Entoloma sericatum
Entoloma sericellum
Entoloma sericeum
Entoloma solstitiale
Flammulaster rhombosporus
Flammulaster subincarnatus
Flammulina elastica
Galerina allospora
Galerina atkinsoniana
Galerina camerina
Galerina cephalotricha
Galerina cerina
Galerina hypnorum
Galerina marginata
Galerina mniophila
Galerina paludosa
Galerina pumila
Galerina salicicola
Galerina vittiformis
Gamundia hygrocyboides
Gamundia striatula
Gomphidius flavipes
Gomphus clavatus
Grifola frondosa
Gymnopilus penetrans
Gymnopilus sapineus
Gymnopus androsaceus
Gymnopus confluens
Gymnopus dryophilus
Gymnopus inodorus
Gymnopus ocior
Gymnopus peronatus
Gymnopus putillus
Gyromitra esculenta
Gyromitra gigas
Gyromitra infula
Hebeloma fragilipes
Hebeloma hiemale
Hebeloma incarnatulum
Hebeloma radicosum
Hebeloma sordescens
Hebeloma velutipes
Helvella cupuliformis
Helvella lacunosa
Helvella macropus
Hemimycena delectabilis
Hemimycena mairei
Hemimycena pseudocrispula
Hemimycena sordida
Hemimycena subtilis
Hericium cirrhatum
Hericium coralloides
Hohenbuehelia nigra
Hohenbuehelia petalodes
Humaria hemisphaerica
Hydnum repandum
Hydnum rufescens
Hygrocybe cantharellus
Hygrocybe conica var. conica
Hygrocybe constrictospora
Hygrocybe glutinipes var. glutinipes
Hygrocybe laeta
Hygrocybe reidii
Hygrophorus erubescens
Hygrophorus olivaceoalbus
Hygrophorus piceae
Hymenochaete tabacina
Hypholoma capnoides
Hypholoma ericaeoides
Hypholoma fasciculare
Hypholoma marginatum
Hypholoma polytrichi
Hypocrea gelatinosa
Hypomyces luteovirens
Hypsizygus ulmarius
Infundibulicybe gibba
Infundibulicybe squamulosa
Inocybe albovelutipes
Inocybe amethystina
Inocybe cookei
Inocybe geophylla
Inocybe griseolilacina
Inocybe jacobi
Inocybe lacera
Inocybe lanuginosa
Inocybe maculata
Inocybe mixtilis
Inocybe perlata
Inocybe phaeodisca
Inocybe putilla
Inocybe subcarpta
Inocybe subnudipes
Inocybe urceolicystis
Kuehneromyces lignicola
Kuehneromyces mutabilis
Laccaria bicolor
Laccaria proxima
Lactarius aurantiacus
Lactarius auriolla
Lactarius deterrimus
Lactarius flexuosus
Lactarius glyciosmus
Lactarius helvus
Lactarius hysginoides
Lactarius leonis
Lactarius mammosus
Lactarius musteus
Lactarius plumbeus
Lactarius pubescens
Lactarius repraesentaneus
Lactarius rufus
Lactarius torminosus
Lactarius trivialis
Lactarius utilis
Lactarius uvidus
Lactarius vietus
Laetiporus sulphureus
Leccinum albostipitatum
Leccinum aurantiacum
Leccinum scabrum
Leccinum versipelle
Lentinellus micheneri
Lentinus vulpinus
Leotia lubrica
Lepiota clypeolaria
Lepiota cristata
Lepiota felina
Lepista sordida
Lichenomphalia umbellifera
Lycoperdon molle
Lycoperdon nigrescens
Lycoperdon perlatum
Lycoperdon pyriforme
Lycoperdon umbrinum
Macrotyphula fistulosa
Macrotyphula juncea
Marasmius epiphyllus
Marasmius rotula
Megacollybia platyphylla
Melanoleuca melaleuca
Melanoleuca polioleuca
Melanoleuca strictipes
Mycena acicula
Mycena aciculata
Mycena adonis
Mycena algeriensis
Mycena amicta
Mycena capillaripes
Mycena citrinomarginata
Mycena clavicularis
Mycena delectabilis
Mycena epipterygia
Mycena erubescens
Mycena fibula
Mycena fragillima
Mycena galopus
Mycena haematopus
Mycena hiemalis
Mycena laevigata
Mycena leptocephala
Mycena metata
Mycena mirata
Mycena niveipes
Mycena olida
Mycena olivaceomarginata
Mycena pelianthina
Mycena pseudopicta
Mycena pura
Mycena silvae-nigrae
Mycena stipata
Mycena stylobates
Mycena subcana
Mycena tristis
Mycena viridimarginata
Mycena vitilis
Mycena vulgaris
Mycenella lasiosperma
Mycetinis querceus
Myxomphalia maura
Neolentinus cyathiformis
Neolentinus lepideus
Omphaliaster asterosporus
Ophiocordyceps gracilis
Ossicaulis lignatilis
Otidea leporina
Otidea platyspora
Panus neostrigosus
Paxillus involutus
Peziza arvernensis
Peziza michelii
Pholiota astragalina
Pholiota flammans
Pholiota lenta
Pholiota limonella
Pholiota lubrica
Pholiota spumosa
Pholiota squarrosa
Pholiota subochracea
Pholiotina parvula
Pleurotus pulmonarius
Pluteus cervinus
Pluteus chrysophaeus
Pluteus cyanopus
Pluteus exiguus
Pluteus leoninus
Pluteus nanus
Pluteus petasatus
Pluteus phlebophorus
Pluteus plautus
Pluteus podospileus
Pluteus pouzarianus
Pluteus romellii
Pluteus salicinus
Pluteus semibulbosus
Pluteus umbrosus
Polyporus ciliatus
Polyporus melanopus
Polyporus squamosus
Polyporus varius
Psathyrella caput-medusae
Psathyrella fatua
Psathyrella fusca
Psathyrella larga
Psathyrella pygmaea
Psathyrella squamosa
Pseudoclitocybe cyathiformis
Pseudoomphalina pachyphylla
Pseudoplectania melaena
Pseudoplectania nigrella
Psilocybe inquilinus
Psilocybe montana
Psilocybe phyllogena
Psilocybe turficola
Pterula multifida
Ramaria pallida
Ramaria tsugina
Ramariopsis asperulospora
Ramariopsis crocea
Ramariopsis subtilis
Rhodocollybia butyracea var. asema
Rhodocollybia fodiens
Rhodocollybia maculata var. maculata
Rickenella fibula
Rickenella swartzii
Roridomyces roridus
Russula acrifolia
Russula aeruginea
Russula amethystina
Russula aquosa
Russula atroglauca
Russula badia
Russula claroflava
Russula consobrina
Russula decolorans
Russula depallens
Russula emetica
Russula foetens
Russula gracillima
Russula grisescens
Russula medullata
Russula puellaris
Russula renidens
Russula rhodopus
Russula rivulicola
Russula sapinea
Russula sphagnophila
Russula torulosa
Russula versicolor
Russula xermpelina
Sarcosoma globosum
Schizophyllum amplum
Simocybe sumptuosa
Spathularia rufa
Sphaerobolus stellatus
Strobilurus stephanocystis
Strobilurus tenacellus
Stropharia albonitens
Stropharia hornemannii
Stropharia pseudocyanea
Suillus acidus
Suillus pictus
Suillus placidus
Suillus sibiricus
Suillus variegatus
Tephrocybe rancida
Trichoglossum hirsutum
Tricholoma fulvum
Tricholoma inamoenum
Tricholoma rapipes
Tricholoma stiparophyllum
Tricholoma sudum
Tricholoma virgatum
Tricholoma viridilutescens
Tricholomopsis decora
Tricholomopsis rutilans
Trichophaeopsis bicuspis
Tubaria confragosa
Tubaria conspersa
Tubaria furfuracea
Tylopilus felleus
Typhula erythropus
Xeromphalina campanella
Xeromphalina fraxinophila
Analysis
Taxonomic, ecological structure and species richness curves
The final list of macrofungi in the vicinities of Khanty-Mansiysk has encompassed 460 species from 6 classes, 14 orders, 55 families and 130 genera. The Agaricales is the richest order comprising 75% of the total species number, followed by Russulales (10%), Boletales (3%), Pezizales (3%), Polyporales (2%) and others in minority.
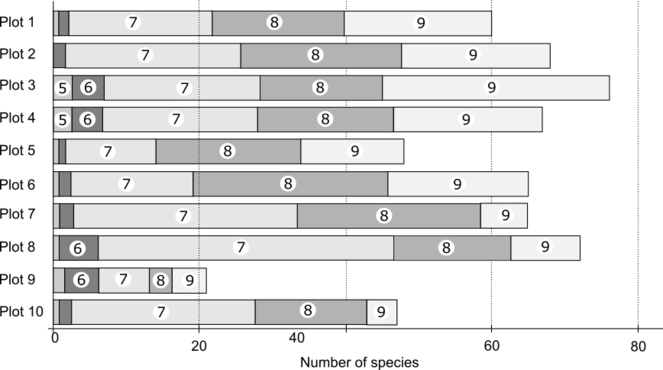
The total number of species revealed during plots observations reached 313, which represents 2/3 of the total species list revealed during the survey. Another 147 species were not registered inside permanent observation plots but were found during random routes laid out in the vicinities of the plots. The number of species differed substantially between plots: it was the lowest in the bogged site (plot 9) – 21 species/100 m2 and the highest in the fresh cutting site (plot 8) – 72 species/100 m2. The average number of species between four plots in dark coniferous forests (plots 1-4) was 67 species and the average species number in secondary forests was 56.
The Shannon index, calculated for species abundances in plots, varied between 2.7 and 4.1, where the minimum value corresponded to the bogged site due to low species number and other 9 plots had close values, on average = 3.8.
The total number of sporocarps counted during the field season (=density per season) reached 5309 sporocarps (e.g. 5309 sporocarps per vegetation season/1000 m2) Table
Sporocarps densities by plots counted once in each month, number of sporocarps/100 m2
|
Plots |
May |
June |
July |
August |
September |
All season, sum |
|
Plot 1 |
1 |
4 |
153 |
136 |
201 |
495 |
|
Plot 2 |
2 |
165 |
126 |
222 |
515 |
|
|
Plot 3 |
41 |
22 |
98 |
123 |
193 |
477 |
|
Plot 4 |
24 |
18 |
192 |
139 |
125 |
498 |
|
Plot 5 |
3 |
5 |
75 |
115 |
109 |
307 |
|
Plot 6 |
26 |
8 |
66 |
188 |
228 |
516 |
|
Plot 7 |
6 |
23 |
256 |
90 |
194 |
569 |
|
Plot 8 |
25 |
40 |
728 |
79 |
138 |
1010 |
|
Plot 9 |
32 |
26 |
202 |
21 |
59 |
340 |
|
Plot 10 |
5 |
6 |
348 |
190 |
33 |
582 |
|
Sum, sporocarps/1000 m2 |
163 |
154 |
2283 |
1207 |
1502 |
5309 |
The analysis of sporocarps density per season within micro-plots (5 m2) revealed a high standard deviation between different micro-plots of the same plot and absence of statistically significant differences between densities of different plots. An analysis of number of species by micro-plots showed similarly high standard deviation. The average number of species within a micro-plot differed significantly only between bogged site and some other plots. The statistical analysis using micro-plots counts is not fully justified, however, because the size of micro-plots is too small to fit the community.
The total species number changed over the season, being 9, 24, 161, 140 and 115 from May to September respectively. The species number was equally high in July, August and September on all plots, but there were less species in September in aspen and birch forests and relatively higher number of species in July in fresh cutting sites (Fig.
Regarding the phenology of individual species, 218 species were found with expressed seasonal dynamics. Examples of species fruiting in early summer (May-June) are: Entoloma sericeum, Pseudoplectania nigrella, Mycena viridimarginata and others. Some species were fruiting in mid-summer (July), for example: Armillaria lutea, Galerina vittiformis, Mycena epipterygia; and some in late summer (August-September): Cortinarius decipiens, C. parvannulatus, Inocybe urceolicystis, Crepidotus epibryus. Other species could have prolonged fruiting throughout the whole of the vegetation season, or intermediate between mentioned types.
The analysis of the total species list by trophic groups showed that saprotrophic species prevailed (60%) with the rest being ectomycorrhizal (38%) and parasitic (2%) species (Fig.
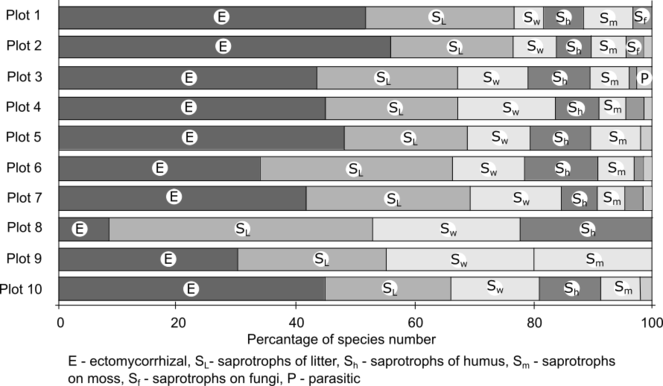
Within the class of saprotrophic species, the prevailing group is saprotrophs of litter layer (45%), followed by lignicolous species (26%), saprotrophs on humus layer (19%), saprotrophs on moss (7%) and on mushrooms (3%). The trophic structure differs between the plots: the percentage of saprotrophic and ectomycorrhizal species was nearly equal in plots 1-5, 7 and 10 (all coniferous forests, one of two plots in aspen forest and birch forest). The number of saprotrophic species was twice as high in one of two plots in birch-aspen forest (plot 6) and three times higher in the bogged site (plot 9). Contrastingly, the percentage of saprotrophic species in the fresh cutting site (plot 8) reached 92% with mycorrhizal species being in minority. The proportion of groups within the saprotrophic class was nearly equal between plots except for the absence of saprotrophs of the humus layer in the bogged site and the absence of saprotrophs on moss in the fresh cutting site.
Within the class of ectomycorrhizal species, the largest group was symbionts of coniferous trees (40%), followed by an equal number of species of deciduous (30%) and broad spectrum symbionts (30%).
The species accumulation curves built for all 10 plots individually with extrapolations to a total of 200 micro-plots allowed comparison of predicted species richness (Fig.
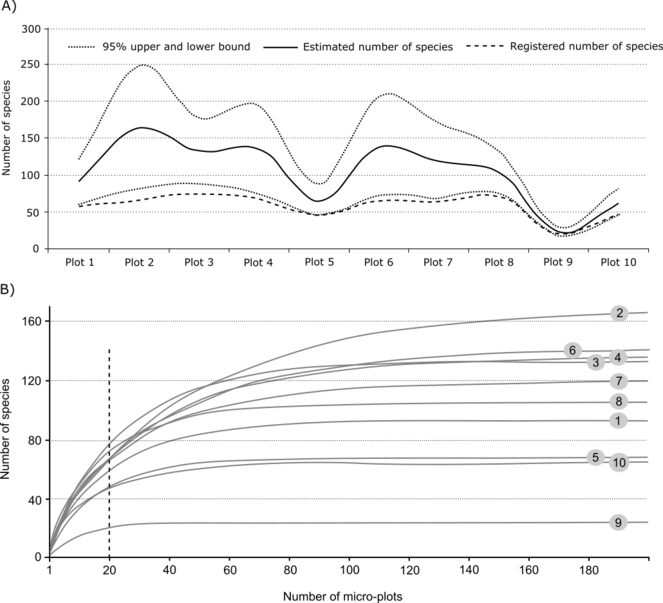
Estimates species richness and species accumulation curves for 10 plots of macromycetes observations in different forest types in vicinities of Khanty-Mansiysk, West Siberia: A) Estimated species richness with 95% upper and lower limits and registered species number, B) Species accumulation curves built on 20 observed micro-plots (dotted line) with extrapolation up to 200 micro-plots (1000 m2) (confidence interval not shown in the picture).
Analysis of fungal community structure in different forest types
The cluster analysis helped to reveal a logical classification of ten studied plots on the basis of composition and abundance of fungal species, although it was difficult to make this classification manually (Fig.

Cluster dendrograms built by average agglomerative clustering (UPGMA) based on chord distance matrix of abundance data of fungi amongst 10 plots of macromycetes observations in different forest types in vicinities of Khanty-Mansiysk, West Siberia: A) all trophic groups altogether, B) separate analysis for saprotrophic species, C) separated analysis for ectomycorrhizal species.

Additionally, the cluster analysis of fungal communities was made separately for saprotrophic and ectomycorrhizal species (Fig.
The abundance and occurrence distribution of species are important characteristics of the community. When considering abundance distribution, the number of cases of singletons (registration in only one micro-plot within the plot) was the highest, the number of cases when species occurred in 2-9 micro-plots was two times lower and the number of cases when the species occurred in more than half plots was only 13 (Fig.
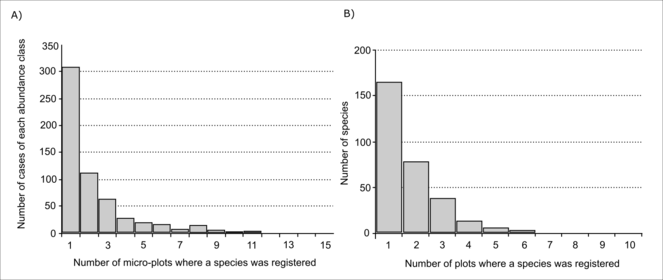
The occurrence of species characterises its presence in all or only part of the studied plots; about half of the species (53%) were registered in only one plot, 45% were registered in 2-5 plots and only 3% of species were registered in more than half of the plots (Fig.
Concerning the question of ubiquity of some species, it is interesting to consider restriction of species to a particular community. To answer the question, a Principal Component Analysis was performed on pre-transformed species abundance data (single- and doubletons were previously removed to simplify the process). The grouping of plots on Scaling 2 biplot corresponds to four clusters made by cluster analysis (Fig.

PCA analysis of pre-transformed species abundance matrix for 10 plots of macromycetes observations in different forest types in vicinities of Khanty-Mansiysk, West Siberia. Left: Scaling 1 biplot showing species contribution to axes 1 and 2 (only species with high contribution shown), Right: Scaling 2 biplot showing grouping of plots on the axes 1 and 2 (species were omitted from the biplot for clarity).
Discussion
Methodology
The methodology of plot-based studies of macromycetes has been developed by many authors (
The plot size for fungal permanent plots should be larger than for vegetation due to the сoarser mosaic of fungal communities and recommended to be 1000 m2 for forests and about 500 m2 for grass- and heathlands (
The replication of plots is important to study the variation in the fungal communities and to make statistical analyses where 10-20 plots per vegetation type would be a desirable number. However, plot-based studies require large effort and this number is hardly possible unless a group of people are involved. In this case, replicate plots were made in coniferous forests (4 plots) and in secondary aspen forests (3 plots). The analyses showed that replicate plots differed from each other by the number of parameters (species composition, species richness, sporocarps densities etc.). For example, within secondary forests, plot 5 differed markedly by number of species probably due to the differences in micro-habitat conditions. Nevertheless, the differences within a common type was lower than differences between different types of plots as shown by cluster analysis and PCA. In addition, replicate plots showed that differences between replicate plots were higher for fungal communities compared to vegetation (showed by cluster analysis) which shows vegetation being more homogenous compared to fungal communities.
The replicate plots (samples) are also important for construction of species accumulation curves, although this requires a much higher number of plots than used in this study. Instead, micro-plots (5 m2) were used as the sample unit to build species accumulation curves and estimate predicted species number.
Frequency and duration are important parameters for a plot-based study design due to the dynamics of sporocarps appearance during the season and through the years. Therefore, a researcher should provide periodical observations of the studied plots (a frequency about 10 days recommended). In this study, one plot or a route per day were visited followed by a day of laboratory work. With this schedule, all 10 plots and 5 routes were visited 5 times per vegetation season (1 time per month from May until September). With regard to the duration of the study, this first year of observation brought preliminary results which will be further continued in the following years of observations. Fortunately, the weather was quite favourable for fungal fruiting during this year with an unusually large amount of precipitation in June-July which allowed a high diversity of species to be revealed.
The expression of quantity of species during a plot-based survey could be done in several ways. Counting of the actual number of sporocarps is laborious but it is the most exact way and it was employed in the study. The resulting data are number of sporocarps per area per visit (sporocarps density) and the sum of visits could create an accumulated sporocarps density during the season. Since the visits were rather rare (part of sporocarps surely appear and vanish in between monthly visits), the accumulated sporocarp density during the season has most likely been under-estimated. A more appropriate characteristic in this case is the maximum species density per observation period. However, nobody has yet estimated an accumulated density of fungal fruiting in the region and this characteristic has been provided as a preliminary estimation.
Sporocarp density is an inappropriate characteristic for further analysis as it counts vegetative structures rather than individuals (genets) and is biased toward species producing many sporocarps per mycelium (e.g. Pholiota spp.) vs. species with few sporocarps per mycelium (e.g. Amanita spp.). In order to operate with genets, an assumption was used that for most species, sporocarps separated by 10 m or more represent a functional individual for terrestrial macrofungi (
Species composition
The analysis of taxonomical structure of the total list was undertaken in the authors'previous work
Phenology
Fruiting phenology in the year of study showed a peak of total sporocarps density in July with a subsequent decline in August and a slight rise in September. The analysis of two major trophic groups separately (ectomycorrhizal and saprotrophic species) showed that the July peak was mostly made up by saprotrophic species (mainly in the fresh cutting site), while ectomycorrhizal species fruited with equal densities in July and August and subsided in September. Fruiting with a single peak at the end of summer is typical for the boreal zone with its short cool summers. However, the observed fruiting pattern could be biased by the unusually high summer precipitation level in 2015 (1.7 and 2.8 times higher than the average in June and July respectively). Subsequent years of plot-based observations may reveal possible correlations between weather parameters and fruiting patterns.
The community composition changed through the season: only 6 species were fruiting in May, 10 species in June, about 50 species in July, the largest set of species fruited during August-September and late fruiting in mid-September was observed in 15 species.
Analysis of fungal community structure in different forest types
One of the main objectives of the plot-based study was to show the differences between fungal communities in different forest types following clear cut and bogging successions. Although the ten studied plots were located close to one another (within a 5 km radius) and the propagules could easily reach all sites, the fungal communities differed significantly. With regard to clear cut impact, three stages of succession were considered, e.g. 5, 20-30 years after clear cut and intact coniferous forests. The plots located in the forests of different stages were united in three groups by cluster analysis and PCA. The differences between fungal communities of these groups were related to species composition and their relative abundance, but the total number of species in all stages was nearly similar (from 48 to 76 species, 65 species on average). As for the total plot densities of fruiting, the fresh cutting site had nearly twice the number (about 1000 sporocarps/per plot/per season) compared to later stages (equally about 500 sporocarps in aspen forests and in coniferous forests). The fresh cutting site also differed by the highest average number of species within a micro-plot (11 species). The trophic structure of the first stage of succession differed by prevalence of saprotrophic species. A few (6) mycorrhizal species, most probably related to the roots of isolated surviving trees, represented only 3% of total sporocarps density of this plot. Within the saprotrophic group, the fresh cutting site differed by absence of moss saprotrophs (Galerina and others) which corresponded to the scarce moss cover observed on the site. In 20-30 years since the clear cut, the density of fruiting halved and the number of species within a micro-plot dropped to an average of 7. Besides, the trophic structure of the species list was made up by about a half of mycorrhizal species and a significant fraction of saprotrophs on moss (despite the still fragmented moss cover in aspen forests). The characteristic species at this stage were saprotrophs of well-developed leaf litter layer (species of Crepidotus, Mycena, Clitocybe, Rhodocollybia) and two species of Cortinarius – symbionts of deciduous trees. The old coniferous forests as the final stage of the succession were characterised by a similar number of species, densities and number of species within a micro-plot as compared to secondary aspen forests. The trophic structure also corresponded to that of aspen forests. Thus, the later stages of succession affected mainly the species composition of the fungal community. The characteristic species at this stage were several mycorrhizal and saprotrophic species.
Ecological succession after logging had been described for ectomycorrhizal (ECM) species by
The bogging process is very common in the boreal zone of West Siberia and two plots (9 and 10) were located to study the impact of this factor on the fungal community. The plots were located in proximity and represented different stages of bogging replacing earlier coniferous forest. Although the clustering of vegetation plots showed similarity between these two plots, the fungal community showed another pattern. Plot 10 (wet birch forest) was united with coniferous forest plots while plot 9 (bogged site) significantly differed from the rest of clusters. However, when the separate analysis of trophic groups was applied, plot 10 was united with coniferous forests for saprotrophic species and with a secondary cluster for mycorrhizal species. It is speculated that the the fungal community is more resistant to changes compared to vegetation on the first stages of bogging succession but changes significantly when the bogging is developed. During the initial stages of bogging, the community of ectomycorrhizal fungi changes significantly due the change in the tree canopy. However, the saprotrophic community remains similar to the coniferous forests. The prolonged bogging changes the fungal community drastically. A bogged site differed significantly by number of species (21 vs. 47 in wet forest), lower density (340 vs. 582) and average number of species within a micro-plot (3 vs. 9). The trophic structure differed by a relatively lower number of mycorrhizal species and absence of saprotrophs of humus layer (due to the formed peat layer). When comparing plot 10 with coniferous forests, the total number of species in plot 10 was somewhat lower (47 vs. average 67). The total plot density, number of species within a micro-plot and the trophic structure were nearly identical. The characteristic species of plot 10 were mycorrhizal species of birch (Russula, Cortinarius) and several saprotrophic species (Clitocybe, Rickenella, Mycena) probably preferring wet habitats.
Rare species and conservation
Rarely registered species (singletons, doubletons and species found in random routes) made up more than half of the total species list found during the project, a fact which is partly related to the limited sampling area and short observation time. The rarity of the list was compared with the species occurrence reported in Funga Nordica by
Conclusions
The survey in a poorly explored area in Khanty-Mansiysk vicinities (middle taiga of West Siberia) revealed 460 species of terrestrial macrofungi; 284 of them were recorded for the first time for Khanty-Mansiysk vicinities. The species list differs sufficiently from the lists of adjacent areas indicating insufficient degree of study in each case and the need for further research in our area.
Three hundred and thirteen (313) species were recorded during the plot-based study and an additional 147 species were recorded during random routes near the plots. Although the species accumulation curve built for collective sampling of all plots did not reach an asymptote, the species found during the random survey filled the gap to reach the estimated species number. Despite this theoretical prediction of sufficient degree of diversity surveying, it is believed that many new species of terrestrial macrofungi will be found in the area if surveying continues in the future.
The species diversity of terrestrial macrofungi included about 60% of ectomycorrhizal species forming associations selectively with coniferous (40%) or deciduous trees (30%) or without specialisation to a tree host (30%). The saprotrophic species included plenty of saprotrophs of forest litter (45% of all saprotrophic species) and lignicolous species (26%) while number of saprotrophs of humus was less (18%). These trophic specialisations of macrofungi play a significant role in the carbon and element cycles of the forest ecosystem.
The community of macrofungi showed dynamics in the course of the season: the maximum for fruiting density and the maximum of species number were registered in July with a subsequent decrease in August and slight rise in September. However, the community of ectomycorrhizal species selectively reached their maximum of development for these parameters in July and August and dynamics differed between fungal communities of different vegetation types. Still, the observed fruiting patterns could be biased by the unusually high summer precipitation level during June and July in this year.
The plot-based study revealed differences between communities of terrestrial macrofungi of old coniferous forests, their after-cut secondary formations and bogged stages. During after-cut succession, the number of species does not change significantly, but other parameters undergo significant changes. The community of the fresh cutting site has a higher density and the trophic structure of the community is characterised by prevalence of saprotrophic species. The secondary forest 20-30 years old has the fungal community with reduced density and the number of mycorrhizal species increases. The old coniferous forest is characterised by a similar density and species number as the previous stage, but the composition of ectomycorrhizal species changes to a larger diversity of Cortinarius spp. Each stage has its characteristic species of saprotrophic and mycorrhizal macromycetes. The initial bogging changed the community of ecto-mycorrhizal fungi while the saprotrophic community remained similar to the coniferous forest. The developed bogged site has a totally different fungal community: the sporocarp density and number of species dropped and their composition significantly changed.
While estimating the abundance of species in the plot-based study, a large percentage of rare species with 1-2 registrations per survey was found. Species registered during random routes could also be classified as rare and thus the number of rare species reaches 68% of the total list. Part of them (68 species) are rare within all boreal zones based on literature and should be subjected to special attention by conservation programmes. At present, the survey in Khanty-Mansiysk vicinities allowed records to be revealed of 3 species listed in the Red Data Book of Russia and 9 species listed in the Red Data Book of the Yugra region.
References
- The analysis and classification of fungal communities with special reference to macrofungi.fungi in Vegetation Science, Handbook of Vegetation Science7‑47. https://doi.org/10.1007/978-94-011-2414-0_2
- Krasnaya kniga Rossiyskoy Federatsii (rasteniya i griby) (Red book of Russian Federation (Plants and fungi)).KMK,Moscow.
- Numerical ecology with R.Springer,New York.
- Geografiya i ekologiya goroda Khanty-Mansiyska i ego prirodnogo okruzheniya (Geography and ecology of Khanty-Mansiysk and its surroundings).Izdatelstvo OAO "Infirmazionno-izdatelskiy zentr",Khanty-Mansiysk.
- Ekologiya gribov makromitsetov (Ecology of macromycetes).Nauka,Moscow.
- Models and estimators linking individual-based and sample-based rarefaction, extrapolation, and comparison of assemblages.Journal of Plant Ecology5:3‑21. https://doi.org/10.1093/jpe/rtr044
- Applying IUCN red-listing criteria for assessing and reporting on the conservation status of fungal species.Fungal Ecology4:147‑162. https://doi.org/10.1016/j.funeco.2010.11.001
- The communities of terrestrial macrofungi in different forest types of boreal zone in West Siberia. Version 1.1. Yugra State University Biological Collection (YSU BC) accessed via GBIF.org on 2017-08-14.Sampling_event DatasetURL: https://doi.org/10.15468/ge1hkl
- The diversity of larger fungi in the vicinities of Khanty-Mansiysk (middle taiga of West Siberia).Environmental Dynamics and Global Climate Change7:2. URL: http://journals.eco-vector.com/EDGCC/article/view/6949
- Rastitel'nyy pokrov Zapadno-Sibirskoy ravniny (Vegetation of West Siberian Plain).Nauka,Novosibirsk.
- Mycocoenological methods based on investigations in the Estonian forests.Acta Mycologica4:327‑335. https://doi.org/10.5586/am.1968.028
- Kirk PM, Cannon PF, Minter DW (2008) 10th edition. Ainsworth & Bisby's Dictionary of the fungi.Oxon, UK,Wallingford,771pp.
- Funga Nordica: agaricoid, boletoid and cyphelloid genera.Nordsvamp,Copenhagen.
- Ecological review of fungi order Polyporales s.str., Boletales, Agaricales s.str., Russulales in the mountain forests of the central part of the North-West Caucasus.Mycology and Phytopathology14(4):300‑314.
- Lodge DJ, Ammirati JF, O’Dell TE, Mueller GM, Huhndorf SM, Wang CJ, Stokland JN, Schmit JP, Ryvarden L, Leacock PR, Mata MI (2004) Terrestrial and lignicolous macrofungi. In: Mueller GM (Ed.) Biodiversity of fungi. Inventory and monitoring methods.Elsevier Academic Press,Amsterdam, Boston.
- O'Dell TE, Lodge JD, Mueller GM (2004) Approaches to sampling macrofungi. In: Mueller GM (Ed.) Biodiversity of fungi. Inventory and monitoring methods.Elsevier Academic Press,Amsterdam, Boston.
- Vegan: Community Ecology Package.R package version 2.0 - 7. Available from9URL: http: // CRAN. Rproject. org / package
- R: A language and environment for statistical computing.R Foundation for Statistical ComputingURL: https://www.R-project.org/.
- worldwide RCTac (2017) Team and contributors worldwide. The R Stats Package, version 3.5.0.
- Makromitsety lesnykh fitotsenozov taezhnoy zony i ikh ispol'zovanie (Forest macromycetes of taiga zone and their usage).Nauka,Leningrad.
- Ecological niches and succession of symbiotrophic macromycetes in forest ecosystems of taiga zone. I. Ecological niches.Mycology and Phytopathology32(6):32‑37.
- Krasnaya kniga Khanty-Mansiyskogo avtonomnogo okruga - Yugry (Red book of Khanty-Mansiykiy Autonomous Okrug - Yugra).Basko,Ekaterinburg.