|
Biodiversity Data Journal :
Data Paper (Biosciences)
|
|
Corresponding author: Dylan Craven (dylan.craven@aya.yale.edu)
Academic editor: Luis Cayuela
Received: 16 Jul 2018 | Accepted: 11 Sep 2018 | Published: 27 Sep 2018
This is an open access article distributed under the terms of the CC0 Public Domain Dedication.
Citation:
Craven D, Knight T, Barton K, Bialic-Murphy L, Cordell S, Giardina C, Gillespie T, Ostertag R, Sack L, Chase J (2018) OpenNahele: the open Hawaiian forest plot database. Biodiversity Data Journal 6: e28406. https://doi.org/10.3897/BDJ.6.e28406
|
|
Abstract
Background
This data paper provides a description of OpenNahele, the open Hawaiian forest plot database. OpenNahele includes 530 forest plots across the Hawaiian archipelago containing 43,590 individuals of 185 native and alien tree, shrub and tree fern species across six islands. We include estimates of maximum plant size (D950.1 and Dmax3) for 58 woody plant species, a key functional trait associated with dispersal distance and competition for light. OpenNahele can serve as a platform to test key ecological, evolutionary and conservation questions in a hotspot archipelago.
New information
OpenNahele is the first database that compiles data from a large number of forest plots across the Hawaiian archipelago to allow broad and high resolution studies of biodiversity patterns.
Keywords: Hawaii, forests, islands, biodiversity, community ecology, evolutionary ecology
Introduction
Oceanic islands are hotspots of species endemism and biodiversity that contain an estimated 17% of the world’s plant diversity on just 5% of its area (
While coarse-scale data are used in macroecological studies that examine biodiversity patterns across islands globally (e.g.
General description
To facilitate the analysis of biodiversity patterns within and across islands in Hawaiian forests, we present the OpenNahele database ('nahele' means forest in Hawaiian). This database compiles forest plot data from all six major islands of the Hawaiian archipelago and contains 530 plots, 185 tree, shrub and tree fern species and 43,590 individuals (Tables
Basic description of forest plot data for each data source in OpenNahele.
|
Data Source |
Islands (#) |
Plots (#) |
Plot size (m2) |
Min. DBH (cm) |
Individuals (#) |
Species (#) |
|
Gillespie et al. 2013 |
6 |
15 |
1000 |
2.5 |
1836 |
56 |
|
Ostertag et al. 2014 |
1 |
2 |
40000 |
1 |
14365 |
30 |
|
Knight & Barton |
5 |
35 |
1000 |
1 |
2631 |
74 |
|
NPS PACN |
3 |
150 |
1000 |
1/10 |
13055 |
41 |
|
FIA Hawaii |
5 |
234 |
13-672.5 |
2.54/12.7 |
6898 |
102 |
|
Zimmerman et al. 2007 |
1 |
94 |
100-1017.9 |
2/30 |
4805 |
28 |
Sampled area, number of plots and number of individuals and species per island in OpenNahele.
|
Island |
Sampled area (m2) |
Plots (#) |
Individuals (#) |
Species(#) |
|
Hawai’i Island |
359380 |
380 |
31509 |
114 |
|
Kaua’i Island |
15388 |
22 |
1425 |
67 |
|
Lana’i Island |
3841 |
5 |
426 |
11 |
|
Maui Island |
47945 |
59 |
3980 |
82 |
|
Moloka’i Island |
32000 |
32 |
4985 |
31 |
|
O’ahu Island |
19940 |
32 |
1265 |
59 |
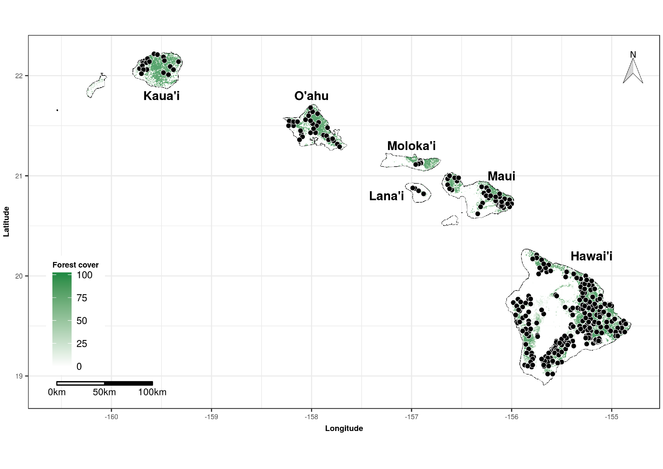
The OpenNahele database can be used to examine cross-scale biodiversity patterns and drivers of and threats to biodiversity across the Hawaiian archipelago. This database provides unprecedented geographic coverage across Hawaiian forests (Fig.
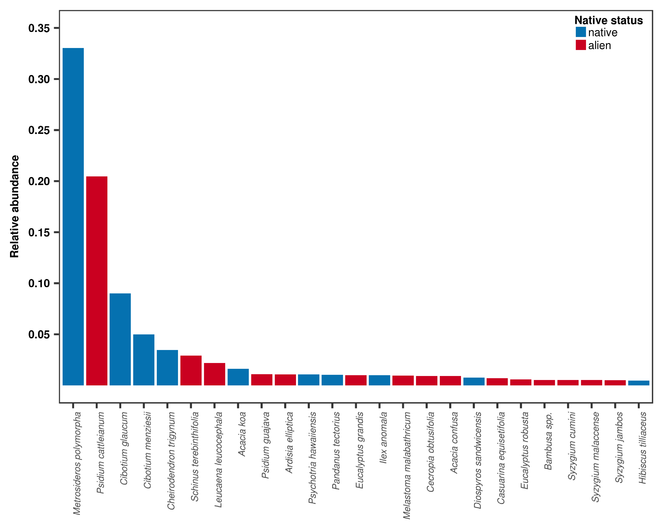
Relative abundance (proportion of individuals) of the 25 most abundant tree, shrub and tree fern species across the Hawaiian archipelago in OpenNahele.
|
Species |
Native status |
Relative abundance |
|
Metrosideros polymorpha |
native |
0.33 |
|
Psidium cattleianum |
alien |
0.20 |
|
Cibotium glaucum |
native |
0.09 |
|
Cibotium menziesii |
native |
0.05 |
|
Cheirodendron trigynum |
native |
0.03 |
|
Schinus terebinthifolia |
alien |
0.03 |
|
Leucaena leucocephala |
alien |
0.02 |
|
Acacia koa |
native |
0.02 |
|
Psidium guajava |
alien |
0.01 |
|
Ardisia elliptica |
alien |
0.01 |
|
Psychotria hawaiiensis |
native |
0.01 |
|
Pandanus tectorius |
native |
0.01 |
|
Eucalyptus grandis |
alien |
0.01 |
|
Ilex anomala |
native |
0.01 |
|
Melastoma malabathricum |
alien |
0.01 |
|
Cecropia obtusifolia |
alien |
0.01 |
|
Acacia confusa |
alien |
0.01 |
|
Diospyros sandwicensis |
native |
0.01 |
|
Casuarina equisetifolia |
alien |
0.01 |
|
Eucalyptus robusta |
alien |
0.01 |
|
Bambusaspp. |
alien |
0.01 |
|
Syzygium cumini |
alien |
0.01 |
|
Syzygium malaccense |
alien |
0.01 |
|
Syzygium jambos |
alien |
0.00 |
|
Hibiscus tilliaceus |
native |
0.00 |
Proportion of invaded plots and median relative abundance (% of individuals) of alien plant species in invaded plots per island across the Hawaiian archipelago in OpenNahele.
|
Island |
Proportion of Invaded plots |
Median relative abundance of alien species |
|
Hawai’i Island |
0.40 |
0.39 |
|
Kaua’i Island |
0.82 |
0.76 |
|
Lana’i Island |
1.00 |
0.19 |
|
Maui Island |
0.49 |
0.66 |
|
Moloka’i Island |
0.06 |
0.05 |
|
O’ahu Island |
0.94 |
0.87 |
The OpenNahele database also can be used to explore ecological differences amongst species. For example, adult plant size can be used to assess the extent to which species’ geographic ranges are related to dispersal or if they are limited by habitat availability (Fig.
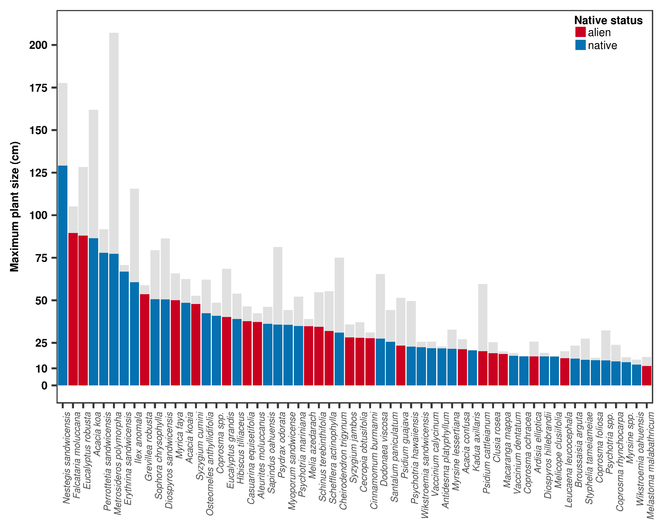
Maximum plant size of 58 plant species across the Hawaiian archipelago. Maximum plant size was estimated from individuals = 5 cm diameter using two methods: i) as D950.1 (shown in colour), which is the 95th percentile of stem diameter of all diameters = 0.1 x maximum observed diameter and ii) Dmax3 (shown in light grey), which is the average diameter of the three largest individuals across the OpenNahele database.
The OpenNahele database will be maintained and curated as data from future censuses and new studies become available to capture temporal dynamics of populations and communities across Hawaiian forests.
Sampling methods
To compile a database of plots in Hawaiian forests (Suppl. material
Studies in the OpenNahele database used different plot sizes and minimum size thresholds (Table
Most studies inventoried trees, shrubs and tree ferns. While tree ferns do not have true wood, they play an important ecological role in Hawaiian forests (
Data from one study within the OpenNahele database, HIPPNET (
Abundance
To facilitate aggregation of abundance data across studies that differ in plot size, we calculated abundance of individuals per species on a per-hectare basis:
Abundance per ha = Abundance / Area x 10,000
where abundance is the number of individuals per species and Area is the plot (or sub-plot) area in square metres.
Individual size was converted to centimetres if measured as DBH or classified as greater than or less than 5 cm DBH if individual size was not measured. As data sources used different minimum DBH thresholds, which may influence the number of individuals in a plot in a systematic way, i.e. plots with larger DBH thresholds will have fewer individuals than those with smaller DBH thresholds and, therefore, species diversity estimates, we removed individuals smaller than 5 cm DBH. To further account for variation in the number of individuals due to differences in plot area across the database, we recommend estimating species diversity based on rarefaction curves (e.g.
Maximum plant size
We estimated maximum plant size for individual species in two ways: as the 95th percentile of stem diameter of all diameters > 0.1 x maximum observed diameter (D950.1) and as the mean diameter of the three largest individuals across the database (Dmax3;
Taxonomic names were resolved and harmonised with The Plant List v. 1.1 (
Geographic coverage
The 530 plots in the OpenNahele database are located on all six major islands of the Hawaiian archipelago (Fig. 1). Forested areas are well covered by plots on most islands and include a wide range of habitat types, from tropical dry forests to subalpine shrublands. However, not all islands were sampled with the same intensity (Table
18.90986 and 22.23583 Latitude; -154.8058 and -160.5458 Longitude.
Taxonomic coverage
In total, the OpenNahele database contains 185 tree, shrub and tree fern species, of which 61% and 39% are native and alien, respectively, and which represent 16% of the 1,155 woody species that occur across the Hawaiian archipelago (
Dominant species
Metrosideros polymorpha is hyperdominant in Hawaiian forests and represents 33% of all individuals greater than 5 cm DBH (Fig.
Usage rights
Data resources
Diameter at breast height (or occurrence) of individual trees, shrubs and tree ferns across 530 plots across the Hawaiian archipelago and includes native status and cultivated status of the 185 species. Available as (Suppl. material
| Column label | Column description |
|---|---|
| Island | Island name |
| PlotID | Unique numeric identifier for each plot |
| Study | Brief name of study |
| Plot_area | Plot area in m2 |
| Longitude | Longitude of plot in decimal degrees; WGS84 coordinate system |
| Latitude | Latitude of plot in decimal degrees; WGS84 coordinate system |
| Year | Year in which plot data was collected |
| Census | Numeric identifier for each census |
| Tree_ID | Unique numeric identifier for each individual |
| Scientific_name | Genus and species of each individual following TPL v. 1.1 |
| Family | Family of each individual following TPL v. 1.1 |
| Angiosperm | Binary variable (1 = yes, 0 = no) indicating whether an individual is classified as an angiosperm following APG III |
| Monocot | Binary variable (1 = yes, 0 = no) indicating whether an individual is classified as a monocot following APG III |
| Native_Status | Categorical variable (‘native’, ‘alien’, ‘uncertain’) indicating alien status of each individual following Wagner et al. (2005) |
| Cultivated_Status | Binary variable (1 = yes, 0 = no, NA = not applicable) indicating if species is cultivated following PIER |
| Abundance | Number of individuals (all = 1) |
| Abundance_ha | Abundance of each individual on a per hectare basis |
| DBH_cm | Diameter at 1.3 m (DBH) for each individual; NA indicates that size was not measured, but was classified by size class |
Maximum plant size of 58 tree, shrub and tree fern species that occur in 530 forest plots across the Hawaiian archipelago. Maximum plant size was estimated as D950.1and Dmax3 following
| Column label | Column description |
|---|---|
| Scientific_name | Genus and epithet of each individual following The Plant List v. 1.1 (2013) |
| Family | Family of each individual following The Plant List v. 1.1 (2013) |
| Native_Status | Categorical variable (‘native’, ‘alien’, ‘uncertain’) indicating alien status of each individual following Wagner et al. (2005) |
| N | Number of individuals used to estimate maximum plant size |
| D95 | Maximum plant size, estimated as D950.1 (King et al. 2006) |
| Dmax_3 | Maximum plant size, estimated as Dmax3 (King et al. 2006) |
Acknowledgements
DC, TMK and JC acknowledge funding by the German Centre for Integrative Biodiversity Research (iDiv) Halle-Jena-Leipzig funded by the German Research Foundation (FZT 118). DC and TMK were additionally funded by the Helmoltz Association and by the Alexander von Humboldt Foundation. Data collected by TMK and KB was achieved with support from the National Geographic Society and the Pacific Island Climate Science Center. All authors thank data providers for collecting the data.
Author contributions
TMK and JC conceived the project, DC and LMB compiled the database, DC wrote the first draft of the manuscript and all co-authors contributed significantly to revisions.
References
- Ainsworth A, Berkowitz P, Jacobi JD, Loh RK, Kozar K (2011) Focal Terrestrial Plant Communities Monitoring Protocol. Focal Terrestrial Plant Communities Monitoring Pacific Island Network NPS/PACN/NRR–2011/410 National Park Service.Fort Collins, Colorado.
- An update of the Angiosperm Phylogeny Group classification for the orders and families of flowering plants: APG III.Botanical Journal of the Linnean Society161:105‑121. https://doi.org/10.1111/j.1095-8339.2009.00996.x
- Global Island Monitoring Scheme (GIMS): a proposal for the long-term coordinated survey and monitoring of native island forest biota.Biodiversity and Conservation27(1):1‑20. https://doi.org/10.1007/s10531-018-1553-7
- Taxonstand: Taxonomic Standardization of Plant Species Names. URL: https://CRAN.R-project.org/package=Taxonstand
- Rarefaction and extrapolation with Hill numbers: a framework for sampling and estimation in species diversity studies.Ecological Monographs84(1):45‑67. https://doi.org/10.1890/13-0133.1
- Embracing scale-dependence to achieve a deeper understanding of biodiversity and its change across communities.Ecology Letters0(0). https://doi.org/10.1111/ele.13151
- Global hotspots and correlates of alien species richness across taxonomic groups.Nature Ecology & Evolution1:0186. URL: http://dx.doi.org/10.1038/s41559-017-0186
- The sizes of species’ geographic ranges.Journal of Applied Ecology46:1‑9. https://doi.org/10.1111/j.1365-2664.2008.01596.x
- Community assembly through adaptive radiation in Hawaiian spiders.Science303:356‑359. https://doi.org/10.1126/science.1091875
- Scaling species richness and endemism of tropical dry forests on oceanic islands.Diversity and Distributions19:896‑906. https://doi.org/10.1111/ddi.12036
- Origin, adaptive radiation and diversification of the Hawaiian lobeliads (Asterales: Campanulaceae).Proceedings of the Royal Society of London B: Biological Sciences276:407‑416. https://doi.org/10.1098/rspb.2008.1204
- Geological age, ecosystem development, and local resource constraints on arthropod community structure in the Hawaiian Islands.Biological Journal of the Linnean Society90:551‑570. https://doi.org/10.1111/j.1095-8312.2007.00748.x
- High-resolution global maps of 21st-century forest cover change.Science342:850. https://doi.org/10.1126/science.1244693
- A global assessment of endemism and species richness across island and mainland regions.Proceedings of the National Academy of Sciences106:9322‑9327. https://doi.org/10.1073/pnas.0810306106
- Growth and mortality are related to adult tree size in a Malaysian mixed dipterocarp forest.Forest Ecology and Management223:152‑158. https://doi.org/10.1016/j.foreco.2005.10.066
- Global diversity of island floras from a macroecological perspective.Ecology Letters11:116‑127. https://doi.org/10.1111/j.1461-0248.2007.01129.x
- Forest structure in low-diversity tropical forests: a study of Hawaiian wet and dry forests.PLOS ONE9:1‑18. https://doi.org/10.1371/journal.pone.0103268
- Floristic biogeography of the Hawaiian Islands: influences of area, environment and paleogeography.Journal of Biogeography31:487‑500. https://doi.org/10.1046/j.0305-0270.2003.00990.x
- Community assembly on isolated islands: macroecology meets evolution.Global Ecology and Biogeography25:769‑780. https://doi.org/10.1111/geb.12341
- Species invasions and extinction: the future of native biodiversity on islands.Proceedings of the National Academy of Sciences105:11490‑11497. https://doi.org/10.1073/pnas.0802290105
- The importance of islands for the protection of biological and linguistic diversity.BioScience65:592‑597. https://doi.org/10.1093/biosci/biv031
- Version 1.1. http://www.theplantlist.org/. Accessed on: 2017-12-01.
- Seed dispersal distance is more strongly correlated with plant height than with seed mass.Journal of Ecology99:1299‑1307. https://doi.org/10.1111/j.1365-2745.2011.01867.x
- The PLANTS Database. URL: http://plants.usda.gov
- Forest inventory and analysis national core field guide, Volume 1. Field data collection procedures for Phase 2 Plots, version 7.1.U.S. Department of Agriculture, Forest Service, Washington Office
- Pacific Island Ecosystems at Risk (PIER). http://www.hear.org/pier/. Accessed on: 2017-12-01.
- Biological invasion by Myrica faya alters ecosystem development in Hawaii.Science238:802‑804. https://doi.org/10.1126/science.238.4828.802
- Flora of the Hawaiian Islands. http://botany.si.edu/pacificislandbiodiversity/hawaiianflora. Accessed on: 2017-5-01.
- Data from: Patterns of primary succession of native and introduced plants in lowland wet forests in eastern Hawai‘i.Dryad Digital Repository. URL: https://doi.org/10.5061/dryad.vp86v3r0
- Patterns of primary succession of native and introduced plants in lowland wet forests in eastern Hawai‘i.Biotropica40:277‑284. https://doi.org/10.1111/j.1744-7429.2007.00371.x
Supplementary materials
Diameter at breast height (or occurrence) of individual trees, shrubs and tree ferns across 530 plots across the Hawaiian archipelago and includes native status and cultivated status of the 185 species.
Maximum plant size of 58 tree, shrub and tree fern species that occur in 530 forest plots across the Hawaiian archipelago. Maximum plant size was estimated as D950.1 and Dmax3 following King et al. (2006).