|
Biodiversity Data Journal :
Research Article
|
|
Corresponding author: Paul Henric P. Gojo Cruz (paulhenricgojocruz@yahoo.com)
Academic editor: Hendrik Freitag
Received: 14 Nov 2018 | Accepted: 07 Feb 2019 | Published: 14 Feb 2019
© 2019 Paul Henric Gojo Cruz, Leticia Afuang, Juan Carlos Gonzalez, William Gruezo
This is an open access article distributed under the terms of the Creative Commons Attribution License (CC BY 4.0), which permits unrestricted use, distribution, and reproduction in any medium, provided the original author and source are credited.
Citation:
Gojo Cruz P, Afuang L, Gonzalez J, Gruezo W (2019) Distribution and diversity patterns of herpetofauna in the Pantabangan-Carranglan Watershed, Nueva Ecija, Caraballo Mountain Range, Philippines. Biodiversity Data Journal 7: e31638. https://doi.org/10.3897/BDJ.7.e31638
|
|
Abstract
The recent extensive survey conducted in the Pantabangan-Carranglan Watershed, located in the Caraballo Mountain Range during the rainy season (October to November) resulted in the recording of fifty-nine (59) species of amphibians and reptiles (17 frogs, 14 skinks, 3 agamids, 6 gekkonid lizards, 2 varanids and 17 snakes). Out of 59 species, 42 species were Philippine endemics and 25 species are recorded only from the Luzon faunal region. Habitat analysis and mapping showed seven habitat types including lowland dipterocarp forest, grassland, lower montane forest, upper montane forest, pine forest, agricultural areas and riparian habitats.
GIS-based distribution mapping showed that the number of individuals and species are high in forest and associated riparian habitats at mid-elevation (1,000–1,250 m a.s.l.). The distribution pattern in the area is influenced by similarity in microclimatic conditions, availability of resources and niches which species can utilise. Species diversity is centred in mid- to high elevation forest and riparian habitats and in less disturbed areas. Snake diversity is adversely affected by increased disturbance, making them good indicators of the health of an area. The abundance-based Jaccard's Similarity Index showed that connected habitats and elevation gradients have higher species similarity.
Keywords
Amphibians, Distribution maps, GIS, Luzon, Philippines, Reptiles
Introduction
The Philippines with its 7,614 islands is home to a diverse herpetofauna with 112 species of amphibians and 361 species of reptiles (
Proper management, conservation and preservation of the country's resources depend, to a large extent, on the availability of current, comprehensive and reliable information on the nature, distribution, magnitude and potential of these natural resources for sustainable utilisation (
Materials and Methods
Survey Areas
The Pantabangan-Carranglan Watershed (PCW) lies between 15°44’ and 16°06’ north latitude and 121°00’ and 121°23’ east longitude (WGS 84) (
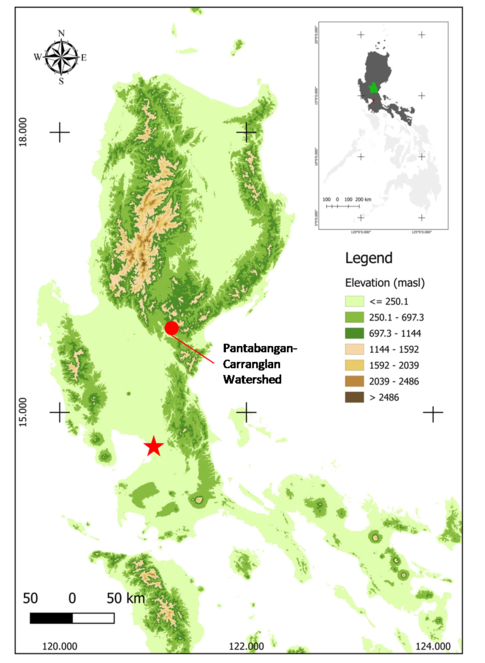
Survey areas included the primary forest, pine forest, grassland areas and agricultural plots located near Sitios Calisitan and Binbin, Baranggay Generel Luna in Carranglan, Nueva Ecija. Areas were surveyed using standardised 10 m x 100 m strip transects (
Vegetable and rice farming are the primary source of income for the residents in the area. Agricultural plots are located in all accessible sites primarily on flat terrains and sloping sides of the mountains. Grassland areas around plots were cleared to accommodate vegetable plots. The forested areas were left since these areas serve as reservoirs for water used in planting. Other anthropogenic disturbances in the area includes logging, wildlife hunting and small-scale mining. Evidence of logging was still present during the survey, with several finished boards of timber products being seen. Traps for large mammals, such as wild pigs and jungle fowls, were also observed, although the locals said that animals caught were mostly for domestic consumption and that hunting is seasonal only. Traces of small-scale mining was also evident within the forest, but most of the tunnels have already been closed following the strict implementation of anti-mining laws promulgated by the community. An emerging threat to the area's wildlife is the expansion of several game fowl farms in the area which resulted in the clearing of several pine tree stands. Moreover, locals report that the guards of these game fowl farms regularly shoot both domesticated and wild animals to protect the fowl.
Aside from anthropogenic activities, natural calamities, including strong typhoons which result in landslides and increased rate of natural grass fires, are threatening the wildlife of the area.
Vegetation Mapping
Quantum GIS Nødebo (ver. 2.16.3) (
Collection and Preservation of Voucher Specimens
Voucher specimens for species were collected under Wildlife Gratuitous Permit no. III-2015-06 and preserved using standardised preservation techniques (
Distribution Mapping
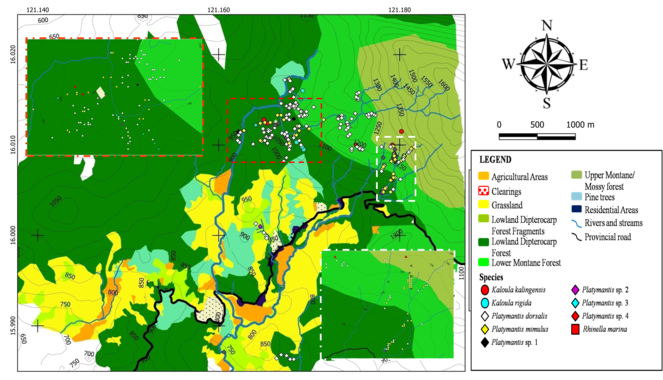
Individuals encountered were geo-tagged using a hand-held GPS device (Garmin eTrex10). The location of each individual was incorporated in the generated vegetation map through Quantum GIS. Distribution maps were created for aquatic frogs, terrestrial frogs, skinks, agamid and gekkonid lizards and snakes for easy visualisation. A density map showing areas of high individual concentration was also generated using the Heat Map tool in Quantum GIS.
Diversity Assessment
The Shannon-Wiener function (H’) was computed using the formula: H’=-∑plnp, where: p = number of individual per species/total number of individuals; ln = natural logarithm.
The Shannon’s-Wiener function was computed for three categorical elevational gradients in this study: Low (elevations between 700–1,016 m a.s.l.), middle (elevations between 1,017–1,183 m a.s.l.) and high (elevations between 1,184 – 1,350 m a.s.l.). The Diversity Index for the different habitat types was also computed. Habitat types included grassland-pine areas, riparian habitats, lowland dipterocarp forest, lower montane forest and upper montane forest. The diversity between edge and interior habitats and disturbed and undisturbed habitats was also assessed. The generated distribution map aided in the determination of species-area association.
Since the Shannon-Wiener function gives the results in bits per species (
N1 = eH'
where: N1 = Hill's number, number of equally common species which would produce the same diversity as H'
e = 2.71828
H' = Shannon-Wiener function
The abundance based Jaccard Index of Similarity (j) (
The total Relative Abundance was computed using: Rel. Abundance = Count in sample X/Total Count in sample X
Results
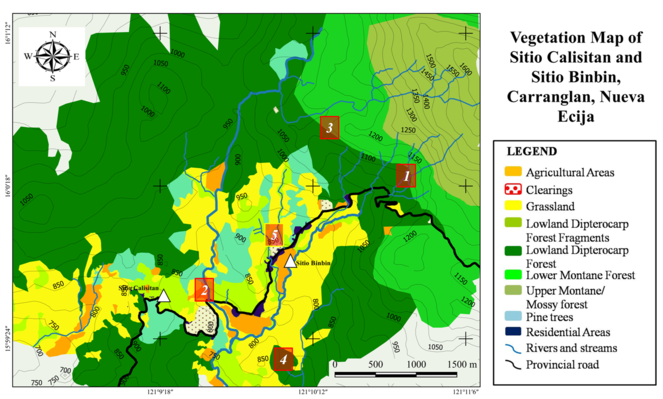
Vegetation Analysis and Mapping
The survey allowed us to identify seven (7) major habitat types in the area. These includes lowland dipterocarp forest, grassland, lower montane forest, upper montane forest, pine forest, agricultural areas and riparian habitats. The size and extent of each habitat type is shown in Fig.
Amphibians and reptiles of Sitio Calisitan and Sitio Binbin, Barangay General Luna, PCW, Carranglan, Nueva Ecija, Caraballo Mountain Range, 2016.
|
SPECIES |
Elevational Range (m a.s.l.) |
HABITAT TYPE |
||||
|
Grassland- Pine Habitat |
Riparian Habitat |
Dipterocarp Forest |
Lower Montane Forest |
Upper Montane Forest |
||
|
Amphibia |
||||||
|
Bufonidae |
||||||
|
Rhinella marina (Linnaeus, 1758) |
800–900 |
X | X | |||
|
Ceratobatrachidae |
||||||
|
Platymantis dorsalis (Dumeril, 1853) |
700–1,300 |
X |
X |
X |
X |
X |
|
Platymantis mimulus Brown, Alcala & Diesmos,1999 |
1,000–1,200 |
X |
X |
X |
||
|
Platymantis sp. 1 |
950–1,350 |
X |
X |
X |
X |
|
|
Platymantis sp. 2 |
1,000–1,250 |
X |
X |
X |
X |
|
|
Platymantis sp. 3 |
1,050–1,200 |
X |
X |
X |
||
|
Platymantis sp. 4 |
1,050–1,100 |
X |
X |
X |
X |
|
|
Dicroglossidae |
||||||
|
Hoplobatracus rugulosus (Wiegmann, 1854) |
800–1,000 |
X |
||||
|
Limnonectes macrocephalus (Inger, 1954) |
800–1,250 |
X |
X |
X |
X |
|
|
Limnonectes woodworthi (Taylor, 1923) |
800–1,250 |
X |
X |
X |
||
|
Occidozyga laevis (Günther, 1858) |
750–1,200 |
X |
X |
X |
||
|
Microhylidae |
||||||
|
Kaloula kalingensis Taylor, 1922 |
1,000–1,350 |
X |
X |
|||
|
Kaloula rigida Taylor, 1922 |
1,100–1,250 |
X |
X |
X |
||
|
Ranidae |
||||||
|
Pulchrana similis (Günther, 1873) |
850–950 |
X |
||||
|
Sanguirana luzonensis (Boulenger, 1896) |
850–1,250 |
X |
X |
X |
X |
|
|
Sanguirana aurantipunctata Fuiten, Diesmos, Welton, Barley, Oberheide, Rico & Brown, 2011 |
1,150–1,250 |
X |
X |
|||
|
Rhacophoridae |
||||||
|
Polypedates leucomystax (Gravenhorst,1829) |
750–950 |
X |
X | |||
|
Reptilia (Lizards) |
||||||
|
Agamidae |
||||||
|
Draco spilopterus (Weigmann, 1834) |
900–1,000 |
X |
||||
|
Hydrosaurus pustulatus (Eschcholtz,1829) |
800–900 |
X |
||||
|
Gekkonidae |
||||||
|
Cyrtodactylus philippinicus (Steindacher, 1867) |
1,050–1,200 |
X |
X |
X |
||
|
Gehyra mutilata (Weigmann, 1834) |
750–900 |
X |
X |
X |
||
|
Gekko gecko (Linnaeus, 1758) |
850–900 |
X |
||||
|
Hemidactylus frenatus (Dumeril & Bibron, 1836) |
750–900 |
X |
||||
|
Hemidactylus garnoti (Dumeril &Bibron, 1836) |
1,200–1,250 |
X |
||||
|
Lepidodactylus cf. lugubris (Dumeril & Bibron, 1836) |
900–1,200 |
X |
X |
|||
|
Scincidae |
||||||
|
Brachymeles bicolor (Gray, 1845) |
950–1,000 |
X |
||||
|
Brachymeles elerae Taylor, 1917 |
1,150–1,250 |
X |
X |
X |
||
|
Eutropis cumingi (Brown & Alcala, 1980) |
800–1,000 |
X |
X |
|||
|
Eutropis multicarinata borealis (Brown & Alcala, 1980) |
750–1,100 |
X |
X |
|||
|
Otosaurus cumingi Gray, 1845 |
950–1,200 |
X |
X |
|||
|
Parvoscincus aurorus Linkem & Brown, 2013 |
1,000–1,250 |
X |
X |
X |
||
|
Parvoscincus agtorum Linkem & Brown, 2013 |
1,050–1,350 |
X |
X |
X |
X |
|
|
Parvoscincus decipiens (Linkem & Brown, 2013) |
950–1,300 |
X |
X |
X |
||
|
Parvoscincus duwendorum Siler, Linkem, Cobb, Watters, Cummings, Diesmos, & Brown, 2014 |
1,100–1,200 |
X |
||||
|
Parvoscincus jimmymcguirei Linkem & Brown, 2013 |
1,100–1,250 |
X |
X |
X |
||
|
Parvoscincus leucospilos (Peters, 1872) |
1,150–1,200 |
X |
||||
|
Parvoscincus palaliensis Linkem and Brown, 2013 |
1,100–1,200 |
X |
X |
|||
|
Parvoscincus sp. |
1,200–1,225 |
X |
||||
|
Pinoyscincus abdictus aquilonius (Brown & Alcala, 1980) |
750–1,000 |
X |
X |
|||
|
Reptilia (Snakes) |
||||||
|
Colubridae |
||||||
|
Ahaetulla prasina preocularis (Taylor, 1922) |
800–850 |
X |
||||
|
Calamaria bitorques Peters, 1872 |
1,100–1,150 |
X |
||||
|
Calamaria gervaisi Dumeril & Bibron,1854 |
750–800 |
X |
||||
|
Dendrelaphis luzonensis Leviton, 1961 |
850–900 |
X |
||||
|
Gonyosoma oxycephalum (Boie, 1827) |
750–800 |
X |
||||
|
Lycodon muelleri Dumeril, Bibron & Dumeril,1854 |
1,150–1,200 |
X |
||||
|
Oligodon ancorus (Girard, 1858) |
1,050–1,100 |
X |
||||
|
Pseudorhabdion cf. mcnamarae (Taylor, 1917) |
1,150–1,200 |
X |
||||
|
Ptyas luzonensis (Günther, 1873) |
1,100–1,150 |
X |
||||
|
Tropidonophis dendrophiops (Günther, 1883) |
900–1,200 |
X |
X |
X |
||
|
Lamprophiiidae |
||||||
|
Cyclocorus lineatus lineatus (Reinhardt, 1843) |
1,000–1,100 |
X |
X |
|||
|
Hologerrhum philippinum Günther, 1858 |
1,050–1,150 |
X |
||||
|
Oxyrhabdium leporinum leporinum (Günther, 1858) |
750–1,200 |
X |
X |
X |
X |
|
|
Viperidae |
||||||
|
Trimeresurus flavomaculatus (Gray, 1842) |
800–1,200 |
X |
X |
X |
||
|
TOTAL |
13 |
34 |
34 |
28 |
8 |
|
Species Account
It is surprising that, despite extensive surveys of the riparian, forest habitats and Pandan axils, we did not detect arboreal species of frogs (e.g. Platymantis sierramadrensis, Philautus surdus, Rhacophorus pardalis) which are otherwise recorded in studies from other parts of Luzon (
Distribution Patterns of Species
Based on the heatmap index, areas with the highest concentration of individual (dark purple areas) have an average of 31 individuals of herpetofauna (Fig.
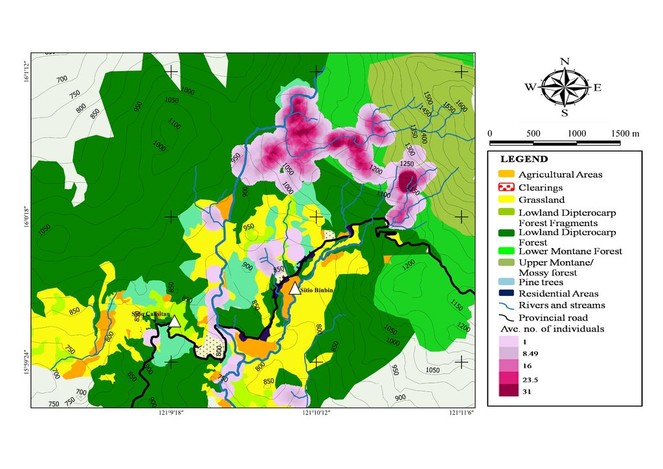
Fewer species and individuals were encountered in areas higher than 1,250 m a.s.l. Endemic species were more common in forest areas while native and introduced species were more common in elevations below 900 m a.s.l. around moderately to heavily disturbed areas (i.e. forest fragments, residential and agricultural areas). Native and introduced species were more tolerant and likely benefited from anthropogenic activities, whereas endemic species have lower tolerance to disturbances resulting from human activities.
Amphibians
The largest concentration of amphibians was found in or around riparian habitats in mid to high elevation forests. Terrestrial species such as Platymantis spp., were found farther from water bodies.
A distribution map of aquatic, semi-aquatic and rhacophorid frogs is presented in Fig.
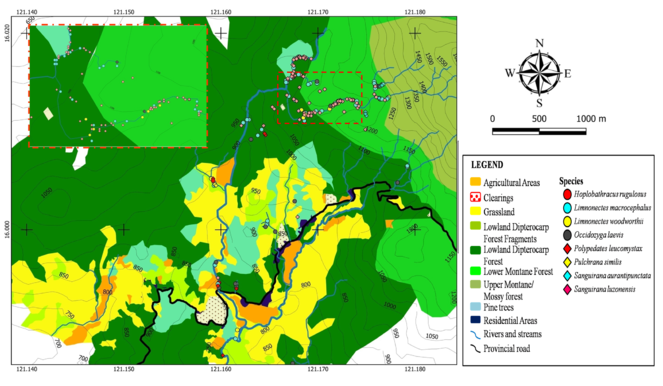
Spatial distribution of terrestrial frogs is presented in Fig.
Reptiles
Fig.
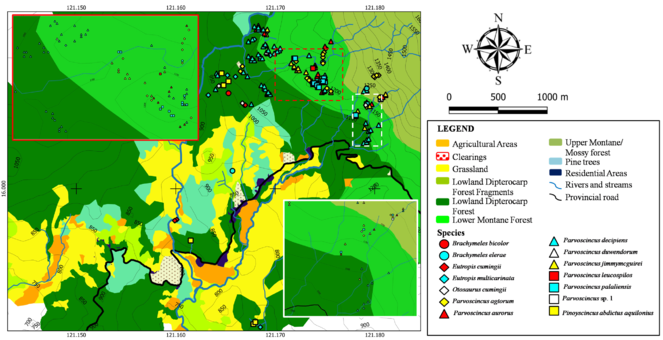
Gekkonid and agamid species were sparsely distributed throughout Calisitan and Binbin, PCW, Carranglan (Fig.
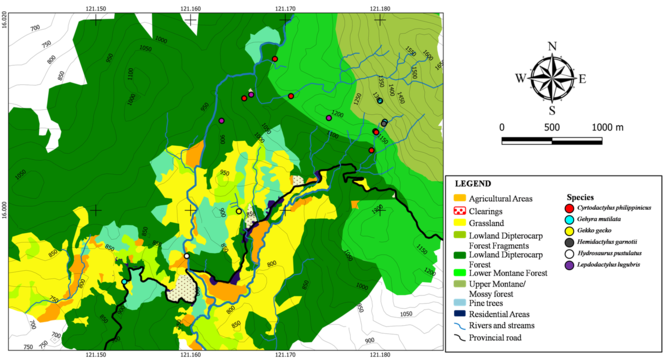
Fig.
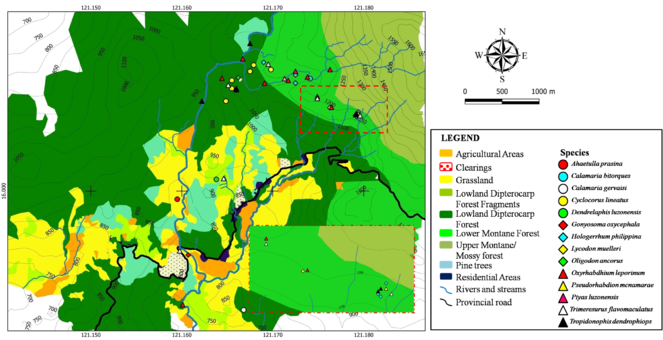
Elevational range extension was detected for Calamaria bitorques (1,143 m a.s.l.), Lycodon muelleri (1,235 m a.s.l.), Oligodon ancorus (1,065 m a.s.l.), Oxyrhabdium leporinum (1,245 m a.s.l.) and Trimeresurus flavomaculatus (1,201 m a.s.l.). According to the data, the upper elevation limitations are C. bitorques 850 m a.s.l.(
Diversity Patterns
Table
Diversity patterns for the herpetofauna collected in Sitios Calisitan and Binbin, PCW, Carranglan, Nueva Ecija, 2016. Numbers in parenthesis indicated the computed Hill's number (N1) given as number of species. Descriptive classification of the Shannon-Weiner function follows
|
PARAMETER |
TAXA |
OVER-ALL SPECIES DIVERSITY |
||
|
Frogs |
Lizards |
Snakes |
||
|
Elevation Gradient |
||||
|
Low |
2.19 (8.94) |
2.26 (9.58) |
1.97 (7.17) |
2.97 (19.49) = Moderate |
|
Middle |
1.82 (6.17) |
1.86 (6.42) |
1.87 (6.49) |
2.59 (13.33) = Moderate |
|
High |
2.18 (8.85) |
1.78 (5.93) |
1.56 (4.76) |
2.71 (15.03) = Moderate |
|
Habitat type |
||||
|
Grassland-Pine Habitat |
1.52 (4.57) |
0.69 (1.99) |
1.39 (4.01) |
2.07 (7.92) = Low |
|
Riparian Habitat |
1.98 (7.24) |
2.24 (9.39) |
1.56 (4.76) |
2.56 (12.94) = Moderate |
|
Lowland Dipterocarp Forest |
1.74 (5.70) |
1.47 (4.35) |
1.54 (4.66) |
2.39 (10.91) = Low |
|
Lower Montane Forest |
1.33 (3.78) |
1.94 (6.96) |
1.57 (4.81) |
2.43 (11.36) = Low |
|
Upper Montane Forest |
2.01 (7.46) |
1.15 (3.16) |
0 (1.00) |
2.16 (8.67) = Low |
|
Effect of edge |
||||
|
Interior |
1.66 (5.26) |
2.13 (8.41) |
1.87 (6.49) |
2.59 (13.33) = Moderate |
|
Edge |
2.08 (8.00) |
2.17 (8.76) |
1.81 (6.11) |
2.7 (14.88) = Moderate |
|
Effect of Disturbance |
||||
|
Undisturbed Areas |
1.95 (7.03) |
2.11 (8.25) |
2.11 (8.25) |
2.73 (15.33) = Moderate |
|
Disturbed Areas |
1.95 (7.03) |
2.11 (8.25) |
1.33 (3.78) |
2.48 (11.94) = Low |
Herpetofaunal diversity at different elevational gradients
As elevation increases, the number of individuals and levels of diversity decreases amongst lizards and snakes. Hill's number for frogs at higher parts of the mountain (>1,184 m a.s.l.) is higher compared to the computed value for frogs at the middle portion (1,017–1,183 m a.s.l.). Since the Shannon-Wiener function takes into account species richness and abundance, this resulted in the lower computed value of H’ for frogs at mid-elevation which is also reflected by Hill's number (6.17 species vs. 8.85 species). The area is less heterogenous, 65% of all the frogs recorded in that elevation gradient is represented by four species (Platymantis dorsalis, P. mimulus, Sanguirana luzonensis and Limnonectes macrocephalus). Diversity and abundance of lizards and snakes are negatively affected by elevation. The effect of elevation on temperature and humidity affecting egg development and thermal physiology may be important, especially for reptiles (
Using abundance-based Jaccard’s Similarity Index (
Herpetofaunal diversity of different habitat types
Species diversity is lowest in grassland-pine habitats (N1 = 7.92) while riparian habitats recorded the highest species diversity for all the taxa (N1 = 12.94). Amphibians in the grassland-pine area were represented by both native (Occidozyga laevis and Polypedates leucomystax) and introduced species (Rhinella marina and Hoplobatrachus rugulosus).
Riparian habitats harboured both native and several endemic species (Limnonectes spp., Sanguirana luzonensis and S. aurantipunctata). Aquatic habitats provide suitable moisture and sites for egg deposition for many species of frogs. The presence of a large number of prey items (frogs and insects) in riparian habitats in turn attracts predators such as snakes and lizards. Riparian vegetation is important in maintaining low water temperatures and also increases connectivity of different habitat types (
In Mt. Makiling, diversity of amphibians and reptiles is high in mid-montane dipterocarp forest (500–600 m a.s.l.) (
The diversity of reptiles in the upper montane forest declined markedly, with no snakes recorded from this habitat type. It should be noted that the pattern of species diversity based on habitat type is comparable to that observed in the effects of elevation gradient. The decrease in diversity in mossy forest is attributed to less stratification resulting in less habitat variety and available niches (
The Similarity Index for the different habitat types showed that riparian habitats have high similarity with dipterocarp forest (0.76), lower montane forest (0.74) and grassland-pine habitat (0.63). This is not surprising since riparian habitats traverse all the other habitat types, making it an important link between habitat types.
Edge effect on herpetofaunal diversity
Frogs showed a higher diversity at edge habitats (N1 = 8.00) , particularly in riparian habitats compared to interior habitats (N1 = 5.26). Based on the distribution map, frogs were more common in riparian habitats associated with forest areas compared to those whose banks were covered with less vegetation (e.g. Binbin River).
Lizard diversity was also different between edge and interior habitats, with more species in interior habitats (20 species) compared to edge habitats (12 species). Only snake diversity showed a decline in edge habitats.
Changes in forest types result in changes in canopy height and density, often resulting in plant growth and density (
Effect of disturbance on herpetofaunal diversity
Disturbance in the area includes anthropogenic disturbances in the form of kaingin and logging activities. Natural disturbances include typhoons, landslide and forest fires. Species diversity for all taxa around disturbed sites (around logging areas, agricultural areas and landslide areas) was lower compared to species diversity in less disturbed sites. Diversity of amphibians and reptiles has an inversely proportional relationship to human encroachment in the environment (
The computed Shannon-Weiner function and Hill's number values may actually be an underestimation of actual diversity due to the following reasons: (1) cryptic speciation amongst Platymantis and Parvoscincus spp. which may have resulted in the misidentification of species; (2) limited sampling of canopy habitats; (3) limited sampling area; and (4) six species were excluded from analysis since no individuals were collected during the survey.
High similarity values between adjacent elevation gradients and habitat types showed that distribution patterns of the species are influenced by shared similarity in microclimatic conditions and availability of resources. It was shown that snake diversity was centred on interior habitats and in undisturbed areas. The presence of snakes may be a good indicator of habitat quality based on their preference for undisturbed areas.
Conclusions
Distribution of herpetofauna in the area is influenced primarily by the microclimatic conditions and availability of resources which a species can utilise. Distribution maps showed that species and individual concentrations are greater in complex habitat types such as forest and riparian habitats compared to less complex habitat types (grasslands, pine forest and agricultural areas). Diversity in the area is centred around mid- to high elevation forests and riparian habitats and in less disturbed, interior areas. Since high species diversity and abundance are concentrated on the riparian habitats and forest areas, conservation of these areas is important. Distribution maps prove to be an important aid for conservation by allowing areas occupied by species to be determined.
Acknowledgements
The author would like to thank the Rufford Small Grant for Nature Conservation (Project no. 19494-1), DOST-ASTHRDP-NSC and IdeaWild Organization for generously funding this research. The Protected Areas Management Board (now BMB) of Pantabangan-Carranglan Watershed, DENR Region III and PASu Joselito Domingo, provided the collection permit for this study. The author would like to thank the members of the survey team: Jen Lepting, Jun Lepting, Jem Lepting, Joseph Lepting, Freddie Palangyos, Rolando Julian, Agusto Yangag, Pablo Binaliw, Ruben Carangian, Simber Lepting, Tirso Palangyos and Dexter Laoyan.
Ethics and security
Wildlife Collection Gratuitous Permit No. III-2015-06 (DENR Reg.III)
References
- Guide to Philippine flora and fauna – Amphibians and Reptiles.X.Natural Resource Management Center, Ministry of Natural Resources and University of the Philippines,Quezon City.
- Chapter 2: mammalian diversity patterns on Mount Palali, Caraballo Mountains, Luzon.Fieldiana Life and Earth Sciences61‑74. https://doi.org/10.3158/2158-5520-2.1.61
- Amphibians and Reptiles of Luzon Island, II: Preliminary Report on the Herpetofauna of Aurora Memorial National Park, Philippines.Hamadryad25(2):175‑19.
- Brachymeles bicolor. The IUCN Red List of Threatened Species 2009: e.T169776A6672495.http://dx.doi.org/10.2305/IUCN.UK.2009-2.RLTS.T169776A6672495.en. Accessed on: 2018-11-07.
- Sphenomorphus cumingi. The IUCN Red List of Threatened Species 2009: e.T169822A6678580.http://dx.doi.org/10.2305/IUCN.UK.2009-2.RLTS.T169822A6678580.en. Accessed on: 2018-11-07.
- Calamaria bitorques. The IUCN Red List of Threatened Species 2009: e.T169787A6673816.http://dx.doi.org/10.2305/IUCN.UK.2009-2.RLTS.T169787A6673816.en. Accessed on: 2018-11-07.
- Oligodon ancorus. The IUCN Red List of Threatened Species 2009: e.T169903A6688428.http://dx.doi.org/10.2305/IUCN.UK.2009-2.RLTS.T169903A6688428.en. Accessed on: 2018-11-07.
- Trimeresurus flavomaculatus. The IUCN Red List of Threatened Species 2009: e.T169885A6686236.http://dx.doi.org/10.2305/IUCN.UK.2009-2.RLTS.T169885A6686236.en. Accessed on: 2018-11-07.
- Amphibians and Reptiles of Luzon Island (Philippines), VII: Herpetofauna of Ilocos Norte Province, Northern Cordillera Mountain Range.CheckList8(3):469‑490. https://doi.org/10.15560/8.3.469
- The amphibians and reptiles of Luzon Island, Philippines, VIII: the herpetofauna of Cagayan and Isabela Provinces, northern Sierra Madre Mountain Range.ZooKeys266:1‑120. https://doi.org/10.3897/zookeys.266.3982
- Abundance-based similarity indices and their estimation when there are unseen species in samples.Biometrics62(2):361‑371. https://doi.org/10.1111/j.1541-0420.2005.00489.x
- The herpetological importance of Mt. Hamiguitan Range, Mindanao Island, Philippines.Banwa4(1):27‑40.
- Preliminary report on the amphibians and reptiles of Balbalasang-Balbalan National Park, Luzon Island, Philippines.Sylvatrop: Technical Journal of Philippine Ecosystems and Natural Resources13:63‑80.
- Diesmos AC (2008) Ecology and Diversity of Herpetofaunal Communities in Fragmented Lowland Rainforests in the Philippines.National University of Singapore
- Amphibians of the Philippines, Part I: checklist of the species.Proceedings of the California Academy of Sciences, Series 462:457‑457.
- Fernando ES (1998) Resource Inventory and Assessment of Biodiversity the Subic Bay Metropolitan Authority Area. Terminal Repor.
- Habitats of Philippine Dipterocarps. Dipterocarps of the Philippines: Factsheet.University of the Philippines Los Banos,Los Banos, Laguna. [ISBN978-971-94434-0-7]
- A New Species of Stream Frog (Sanguirana) from the Mountains of Luzon Island, Philippines.Herpetologica67(1):89‑103. https://doi.org/10.1655/HERPETOLOGICA-D-10-00042.1
- Paradox, presumption and pitfalls in conservation biology: The importance of habitat change for amphibians and reptiles.Biological Conservation138:166‑179. https://doi.org/10.1016/j.biocon.2007.04.017
- Diversity and distribution of herpetofauna in Balesin Island, Polillo, Quezon, Philippines.Sylvatrop: The Technical Journal of Philippine Ecosystems and Natural Resources25(1-2):37‑56.
- Gomez-Roxas P, Boniao RD, Burton EM, Gorospe-Villarino A, Nacua SS (2005) Community-Based Inventory and Assessment of Riverine and Riparian Ecosystems in the Northeastern Part of Mt. Malindang, Misamis Occidental Report. Biodiversity Research Programme (BRP) for Development in Mindanao: Focus on Mt. Malindang and Environs.
- Gonzalez JCT, Dans ATL (1997) Ecology and Distribution of Vertebrate Fauna of Mount. Makiling Forest Reserve. In: Dove MR, Sajise PE (Eds) The Conditions of Biodiversity Maintenance in Asia.East-West Center, University of Hawaii,Honolulu.
- Small mammal diversity along elevational gradients in the Philippines: an assessment of patterns and hypotheses.Global ecology and Biogeography10(1):15‑39. https://doi.org/10.1046/j.1466-822x.2001.00227.x
- Measuring and monitoring biological diversity: Standard methods for amphibians.Smithsonian Institution Press, xvii + 364 pp,Washington, D. C.
- Diversity and evenness: a unifying notation and its consequences.Ecology54(2):427‑432. https://doi.org/10.2307/1934352
- Ecological methodology.Addison Wesley Longman, Menlo Park,CA.
- Assessing climate change impacts, adaptation and vulnerability: The case of the Pantabangan-Carranglan Watershed.World Agroforestry Centre and College of Forestry and Natural Resources, University of the Philippines Los Baños,Los Banos, Laguna,95pp.
- Synopsis of the Snakes of the Philippines: A Synthesis of Data from Biodiversity Repositories, Field Studies, and the Literature.Proceedings of the California Academy of Science64(14):399‑56.
- Amphibians and Reptiles of Luzon Island, V: The Herpetofauna of Angat Dam Watershed, Bulacan Province, Luzon Island, Philippines.Asian Herpetological Research2(4):177‑198.
- Edge effects in fragmented forests: implications for conservation.Trends in Ecology & Evolution10(2):58‑62. https://doi.org/10.1016/s0169-5347(00)88977-6
- Pantabangan Watershed Rehabilitation Project.Watershed Management Department,Quezon City.
- Pantabangan-Carranglan Watershed Management Plan.Watershed Management Department,Quezon City.
- Herpetological diversity along Andean elevational gradients: links with physiological ecology and evolutionary physiology.Comparative Biochemistry and Physiology Part A: Molecular & Integrative Physiology133(3):469‑485. https://doi.org/10.1016/s1095-6433(02)00207-6
- Climate variability and extremes in the Pantabangan-Carranglan Watershed, Philippines: assessment of impacts and adaptation practices.Journal of Environmental Sciences and Management11(2):14‑31.
- Distribution of the birds of the Philippines: biogeography and conservation priorities.Bird Conservation International10(2):149‑167. https://doi.org/10.1017/S0959270900000149
- Quantum GIS Geographic Information System. Open Source Geospatial Foundation Project.Nodebo. URL: qgis.osgeo.org
- Small mammal diversity along an elevational gradient in northern Luzon, Philippines.Mammalian Biology-Zeitschrift für Säugetierkunde76(1):12‑21. https://doi.org/10.1016/j.mambio.2010.01.006
- Measuring and monitoring amphibian diversity in tropical forests. I. An evaluation of methods with recommendations for standardization.Ecotropica10:1‑14.
- GIS-based atlas of selected watersheds in the Philippines.DOST-PCARRD and UPLB-CFNR-ERSG,Los Banos, Laguna.
- Microhabitats reduce animal's exposure to climate extremes.Global Change Biology20(2):495‑503. https://doi.org/10.1111/gcb.12439
- The abundance and diversity of the herpetofaunas of tropical forest litter.Biotropica8(1):41‑58. https://doi.org/10.2307/2387818
- Redescription of Tetradactyl Philippine Slender Skinks (Genus Brachymeles).Herpetologica67(3):300‑317. https://doi.org/10.1655/HERPETOLOGICA-D-10-00071.1
- Taxonomic revision of the semi-aquatic skink Parvoscincus leucospilos (Reptilia: Squamata: Scincidae), with description of three new species.Zootaxa3847(3):388‑412. https://doi.org/10.11646/zootaxa.3847.3.4
- Amphibians and reptiles of Cebu, Philippines: The poorly understood herpetofauna of an island with very little remaining natural habitat.Asian Herpetological Research2016(7):151‑179. https://doi.org/10.16373/j.cnki.ahr.150049
- The Reptile Database. http://www.reptile-database.org. Accessed on: 2018-8-30.
- The distribution, abundance and diversity of birds in Manila's last greenspaces.Landscape and Urban Planning89(3-4):75‑85. https://doi.org/10.1016/j.landurbplan.2008.10.013
- Herpetology: An Introductory Biology of Amphibians and Reptiles.4th Edition.Academic Press,London.