|
Biodiversity Data Journal :
Methods
|
|
Corresponding author: E Louise Allan (louise.allan@nhm.ac.uk)
Academic editor: Pavel Stoev
Received: 11 Dec 2018 | Accepted: 25 Feb 2019 | Published: 01 Mar 2019
© 2019 E Louise Allan, Laurence Livermore, Benjamin Price, Olha Shchedrina, Vincent Smith
This is an open access article distributed under the terms of the Creative Commons Attribution License (CC BY 4.0), which permits unrestricted use, distribution, and reproduction in any medium, provided the original author and source are credited.
Citation:
Allan E, Livermore L, Price B, Shchedrina O, Smith V (2019) A Novel Automated Mass Digitisation Workflow for Natural History Microscope Slides. Biodiversity Data Journal 7: e32342. https://doi.org/10.3897/BDJ.7.e32342
|
|
Abstract
The Natural History Museum, London (NHM) has embarked on an ambitious programme to digitise its collections. One aim of the programme has been to improve the workflows and infrastructure needed to support high-throughput digitisation and create comprehensive digital inventories of large scientific collections. This paper presents the workflow developed to digitise the entire Phthiraptera (parasitic lice) microscope slide collection (70,663 slides). Here we describe a novel process of semi-automated mass digitisation using both temporary and permanent barcode labels applied before and during slide imaging. By using a series of barcodes encoding information associated with each slide (i.e. unique identifier, location in the collection and taxonomic name), we can run a series of automated processes, including file renaming, image processing and bulk import into the NHM’s collection management system. We provide data on the comparative efficiency of these processes, illustrating how simple activities, like automated file renaming, reduces image post-processing time, minimises human error and can be applied across multiple collection types.
Keywords
mass digitisation, automation, microscope slides, Phthiraptera, Data Matrix barcodes, natural history collections
Introduction
Digital surrogates of natural history specimens, comprising a combination of specimen data and images, are creating new audiences and new research opportunities for natural history collections (
We estimate that the NHM holds 2.4 million microscope slides in its collection. These slides are distributed across diverse curatorial groups (e.g. botany, entomology, mineralogy, palaeontology and zoology), with each group having its own distinct slide preparation technique and standards. While automated slide digitisation systems, designed for higher resolution imaging, have existed for over a decade, these have been confined to medical slides with no other large-scale digitisation projects of natural history slides known to us (
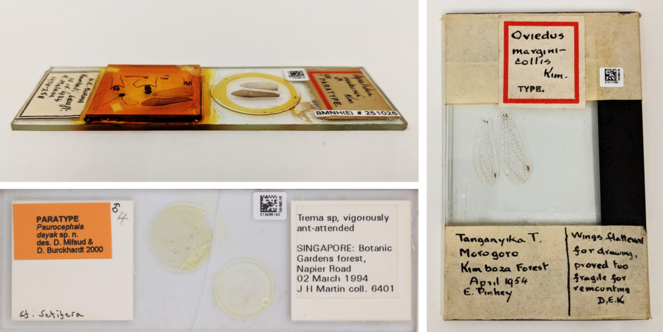
For natural history slide collections, the data on the labels is as important as the slide mounted material / specimen(s). While many of these automated scanners are able to capture a low resolution overview image of the slide, these images tend to be poorly lit, which could impact automated label extraction through optical character recognition. Furthermore, slide holders may partially obscure label data, while labels on the reverse side of the slide cannot currently be captured.
In 2015, the Museum’s DCP ran a pilot project for mass digitisation of microscope slides using a multi-slide imaging template and downstream image segmentation (
In order to increase the efficiency and accuracy of digitisation workflows, more automated processes are needed. In 2017, the DCP began the digitisation of the microscope slide collection of Phthiraptera (~70,000 vertically stored slides). This scientific and culturally important collection is one of the largest of its kind in the world, containing a significant number of previously unidentified species, as well as a vast dataset of host-parasite associations that can only be exploited through transcription of the label data. The aim of the Phthiraptera slide digitisation project was to improve the existing workflow through pre-digitisation preparation of a collection, simplified slide imaging and automated extraction / post-processing of metadata.
This paper addresses four of the five digitisation task clusters outlined by
-
pre-digitisation curation and staging;
-
specimen image capture;
-
specimen image processing;
-
electronic data capture.
In this project, we omitted the final task cluster (georeferencing of specimen data), as our aim was to develop a high-throughput inventory record of the collection and rapid digitisation workflow. Georeferencing remains one of the most challenging and slowest components of digitisation and is less relevant to the digitisation of parasitic lice, since their range is largely circumscribed by the distribution of the host bird or mammal.
General Description
Mass digitisation of specimens requires the creation of an ‘inventory’ specimen record for each object within the Museum’s collection management system (CMS), EMu (© Axiell), consisting of three essential pieces of information: 1) a unique identifier (UID) catalogue number; 2) the current physical location of the specimen in the collection (e.g. cabinet and drawer); and 3) the taxonomic name of the specimen, as currently assigned in the collection.
The Museum’s CMS uses primary keys (numerical values) to uniquely identify location and taxon values, which eliminates the potential for erroneously matching synonyms. Two scripts were developed by Axiell during the 2015 slide digitisation pilot, for the bulk ingestion of specimen images and their associated data into the CMS:
- Specimen record creation: This script takes individual images with metadata encoded in the filename and creates a specimen record with appropriate links to the relevant database tables providing the specimen’s UID, location and taxonomy. In order to create a specimen record using this script, the corresponding location and taxon information are exported as primary keys from the CMS. Example format of encoded metadata: “UIDBarcode_LocationPrimaryKey_TaxonPrimaryKey.jpg”. Note: to ensure duplicate specimen records are not created, the script checks the CMS for a pre-existing record with that UID (if a record already exists, the image file will be attached to the existing record; if no record exists, the script will create a new specimen record).
- Record attachment: This script takes individual images and attaches them to a pre-existing record by matching the UID in the filename with an existing record in the CMS. Example format of encoded metadata: “UIDBarcode_suffix.jpg”. A suffix is used to ensure unique filenames and can be changed depending on the nature of the image i.e. labels only, labels on reverse side of a slide, paper envelopes, high resolution specimen images etc.
The use of primary keys ensures a 1:1 match in the CMS; however manual renaming of files to numerical values is prone to transcription error. Furthermore, numerical values for location and taxon cannot be easily verified before import into the CMS.
The previous slide digitisation pilot (
This approach not only required substantial post-processing time, but also had many limitations. For example, the slides had to be manually tagged using pre-populated drop-down lists and, if there were discrepancies between the list and the physical collection i.e. a missing location and/or taxon, this would halt the tagging process and increase the post-processing time for each slide. Furthermore, as manual tagging of specimen images can also be prone to human error, additional verification steps were needed.
Scripts were also developed in-house to 1) facilitate transfer of image files within a staging area and 2) to ensure the clear down of the original image files from the imaging computer once ingested into the CMS.
Project Description and Workflow
Our Phthiraptera slide digitisation project was designed to reuse the existing bulk ingest scripts; however, additional automated post-processing steps were developed to increase the efficiency of specimen digitisation and reduce the potential for human error. This was accomplished via automated file renaming of the images by incorporating additional barcodes in each image that encoded location and taxon primary key values associated with each specimen. This process had a dramatic impact in improving the efficiency of the digitisation process.
Another key difference between the Phthiraptera slide project and the previous pilot was the change to imaging individual slides rather than batches of slides in templates. This significantly reduced the number of steps required to create a single slide image as well as the amount of specimen handling.
The workflow for whole slide digitisation is summarised below and consists of three modules: 1) pre-digitisation curation, 2) specimen image capture and 3) specimen image processing and electronic data capture (Fig.
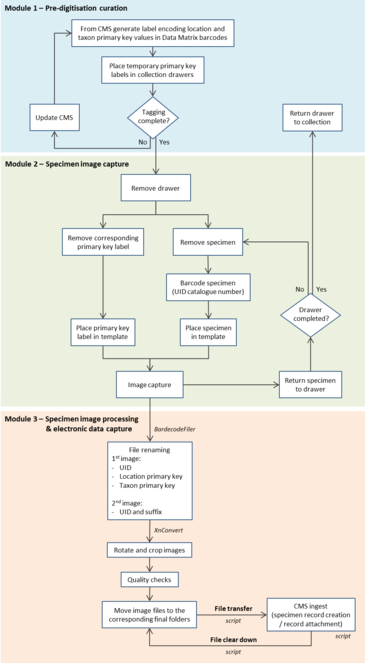
Module 1: Pre-digitisation curation
1. Temporary location and taxon primary key labels were printed directly from the Museum's CMS to ensure a 1:1 match.
-
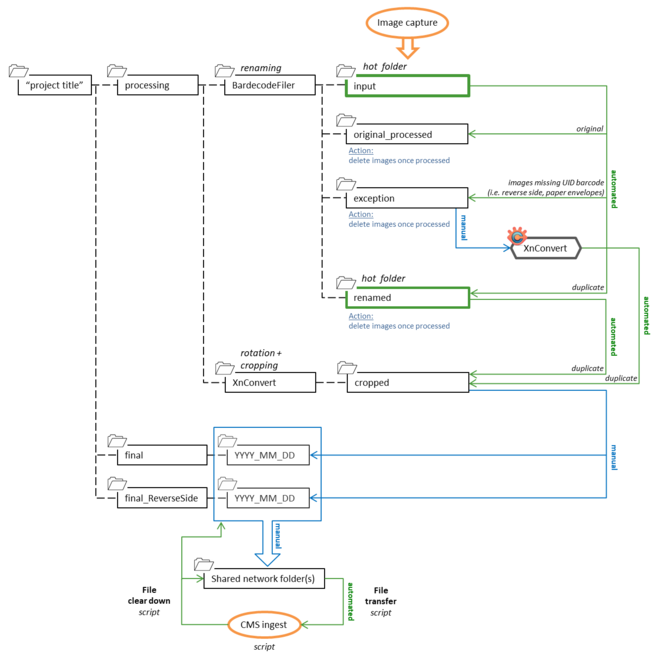
These labels consisted of human-readable information as well as two machine-readable barcodes (Data Matrix ECC 200) that encoded the location and taxon primary key values (example shown in Fig.
4 a). -
The location and taxon primary key values can either be produced as a single label using the index lot association in the catalogue module or as separate labels using the location and taxon modules.
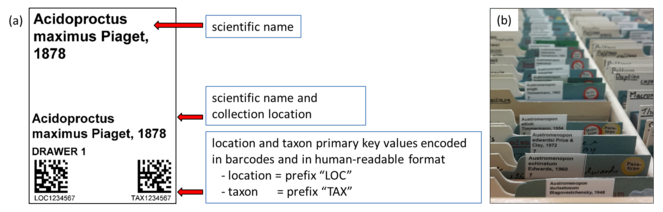
(a) An example of the temporary location and taxon primary key label, encoding these values in two machine-readable Data Matrix barcodes. (b) Temporary location and taxon labels inserted into a slide collection. This label was designed for vertical slide collections but can be adapted for other collection types.
2. The temporary labels were physically inserted into the collection prior to digitisation with curatorial overview (Fig.
3. Once pre-digitisation curation was completed, the drawers were moved to the digitisation station where they were temporarily stored while being digitised.
Module 2: Specimen image capture
1. Before imaging, every slide was given a conservation grade self-adhesive UID barcode label (Data Matrix), which was attached to the glass, if possible, on the upper side of the slide using forceps.
- These UIDs (catalogue numbers) were generated from the Museum’s CMS to ensure unique values and were printed in both a human- and machine-readable format. For consistency and ease of application, the barcode labels are 5 x 6 mm, such that they can be applied without obscuring other label data, fit a range of collection types including slides with limited space and can be reliably read by barcode reading software. The barcode labels, supplied on rolled sheets, were printed by an external supplier on 8100 white polyester and use a permanent solvent acrylic adhesive.
-
The UID can be used to associate additional images or data with a specimen record either by using the record attachment script or data ingestion processes. Some specimens already had an attached UID barcode label and specimen record in the CMS, as they were either digitised as part of a previous project or when sent on loan.
2. The slide, with its UID barcode, was then placed on to the imaging template along with the corresponding location and taxon primary key label.
-
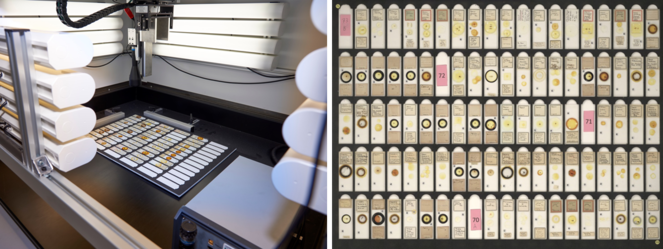
The template was fixed in place within a custom-built lightbox and positioned beneath a vertically mounted camera (Fig.
5 a). -
The template was made from durable white plastic and had a raised ‘L-shaped’ edge to ensure that the microscope slides could be consistently and easily positioned in the same location to enable automated image processing (Fig.
5 b). The ‘L-shaped’ edge contained a grooved area to place the primary key label so that it was positioned above the slide, but within the field of view.
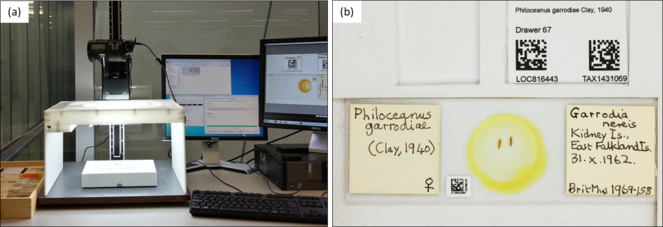
(a) Imaging setup consisting of a vertically mounted DSLR camera, a custom-built lightbox and a slide imaging template fixed in place. (b) Slide imaging template consisting of a raised ‘L-shaped’ edge, where the slide is positioned and a grooved area where the temporary location and taxon primary key label is placed within the field of view.
3. Images were captured using a Canon EOS 5DS R and a 90 mm Tamron lens using Canon EOS Utility v.3.9.0 and saved to a hot folder (folder name: ‘input’).
-
The camera mode was set to manual with the aperture set between f 1/5.6 and 1/7.1; ISO 200 and shutter speed 1/80 sec. The light source consisted of a custom-built lightbox with a 32 W Circline VLR Full Spectrum Vita-Lite 5500 K fluorescent ring bulb.
4. If labels were present on the reverse side of the slide, it was turned over and an additional image was captured. Likewise, if the slide was housed in a paper envelope with additional information, the envelope was placed in the template and an additional image was captured.
Module 3: Specimen image processing and electronic data capture
1. Off-the-shelf software and hot folders were used for automated file renaming and image processing following image capture (Fig.
-
File renaming: the BardecodeFiler software was set to read the three barcodes in the image, UID catalogue number (attached to slide) and location and taxon primary key values (temporary label; Fig.
5 b). This process was carried out using predefined rules in BardecodeFiler and the files were renamed as follows: “UIDBarcode_LocationPrimaryKey_TaxonPrimaryKey.jpg”. -
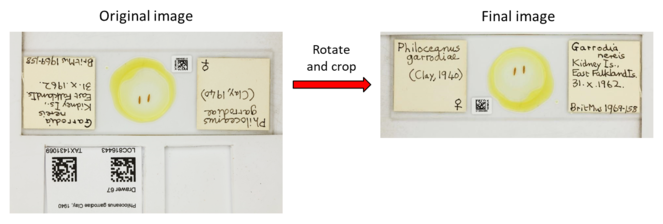
Image processing: XnConvert was set to rotate the images 180° and crop at specific coordinates to remove the temporary location and taxon primary key label from the final image (Fig.
7 ). -
Metadata: information associated with the image (owner’s name, author and copyright) was automatically written to the file EXIF data during image capture using EOS Utility.
2. If the UID barcode was missing in the image i.e. reverse image of a slide, paper envelope etc., the image file was saved to the ‘exceptions’ folder and renamed to “UIDBarcode_additional”.
-
Renaming: the BardecodeFiler software uses the previously read UID barcode to rename the file.
3. At the end of each day, the image files in ‘cropped’ and ‘exceptions’ are manually quality checked.
4. The renamed and processed files in ‘cropped’ are then transferred to a date folder within ‘final’, ready to be copied to the staging area for ingestion into the Museum's CMS using the specimen record creation script. The image files in ‘original_processed’ and ‘renamed’ are then manually deleted.
5. Any additional images saved to ‘exceptions’ are manually copied to the XnConvert software to initiate the automated image processing (rotation and cropping). The images are saved to the ‘cropped’ folder and then transferred to a date folder within ‘final_ReverseSide’, ready to be copied to the staging area for ingestion into the CMS using the record attachment script. The image files in ‘exceptions’ are then manually deleted.
6. The image files in ‘final’ and ‘final_ReverseSide’ were copied daily to the staging area for ingestion into the CMS and then openly published through the Museum’s Data Portal (http://data.nhm.ac.uk,
-
Scripts were used to automate the file transfer within the staging area, as well as the clear down of the original image files from the imaging computer once these files had been ingested into the CMS.
Discussion
To increase the efficiency and accuracy of digitisation workflows, we need to decrease the time taken for image capture and processing, simplify processes and reduce the opportunity for human error. The Phthiraptera slide digitisation project accomplished this by reducing the number of steps required to obtain a single renamed image of a slide; increasing the use of automated processes to rename and process image files; and adopting standardised pre-digitisation preparation of the collection. This adapted workflow allowed the entire microscope slide collection of parasitic lice (70,663 slides) to be digitised and made accessible via the Museum’s Data Portal in eight months using a single digitiser. This individual imaged and processed an average of 696 slides per day (circa 7 working hours), with a maximum real world rate of 1,006 slides per day for uncomplicated sections of the collection such as unidentified accessions, where the variation in specimen data was minimal (Table
Estimation of the base digitisation rate (slides per person per day) for the current Phthiraptera slide digitisation project versus the previous slide digitisation pilot.
|
Slide digitisation pilot* (multi-slide and image segmentation) |
Phthiraptera slide digitisation project (single slide and automated processing) |
|||
|
Volunteers (real world) |
Digitisers (focused testing**) |
Digitisers (focused testing**) |
Digitisers (real world) |
|
|
Min (a) |
59 |
505 |
476 |
370 |
|
Max (b) |
768 |
749 |
1,103 |
1,006 |
|
Median (m) |
173 |
606 |
741 |
700 |
|
Base Rate E = (a+4m+b)/6 |
253 |
613 |
757 |
696 |
|
Standard Deviation SD = (b-a)/6 |
118 |
41 |
105 |
106 |
|
Error Rate (%) |
2.0 - 10.9 |
0.09 |
0.006 |
|
* values obtained from
** focused testing = only digitisation activities occurring
In the Phthiraptera slide digitisation project, we imaged each slide individually rather than utilising the multi-slide and image segmentation approach used in our previous slide digitisation pilot (
The streamlining of the image capture process into a single action also enabled us to replace the manual and semi-automated processes associated with the file renaming and post-processing with more automated (scripted) systems. The automated renaming replaced the use of Inselect to read the UID barcode on each segmented slide (a semi-automated step) and the manual annotation and verification of metadata, thus reducing the potential for human error associated with manual file renaming. This automated file renaming was made possible through pre-digitisation preparation of the collection and insertion of labels that encoded location and taxonomic metadata in barcodes. The use of a fixed imaging template ensured that the slides were consistently positioned in the same location, thus enabling automated image rotation and cropping. To significantly reduce post-processing time, multiple hot folders were used to enable file renaming and image processing to run in the background in real time, while the digitiser continued to image slides.
For the Phthiraptera slide digitisation project, location and taxonomic metadata were sufficient for inventory record creation; however, the workflow can be adapted to capture more data during imaging through the inclusion of additional temporary labels in the image. For example, type status or geographical region can be captured if collections are arranged as such. This multiple barcode digitisation workflow can also be adapted for use with other collection types such as pinned insects, herbarium sheets and spirit preserved material.
As with most workflows that focus on high-throughput digitisation and the production of digital collection inventories, it does not create images that are adequate for specimen-based research, although it does support subsequent label data capture and associated research. Digital inventories are also important for providing increased access to specimens and data, as well as enabling condition checking, which can be automated using computer vision approaches and prioritisation of specimens for subsequent high resolution and specialised imaging. As part of the Phthiraptera slide digitisation project, we imaged a representative of each species, focusing on type material where present, using a modified histology slide scanner, ZEISS Axio Scan.Z1. As expected, a number of slides were unsuitable for the slide scanner and, as a result, specimen imaging for these slides was carried out using a Canon EOS 5DS R with the MP-E 65mm lens, StackShot Macro Rail system (Cognisys Inc.) and a custom flashbox (
In conclusion, this workflow demonstrates that pre-digitisation preparation, process simplification and careful use of automation, were more efficient and effective for digitisation of this large collection. In this particular case, direct use of primary keys from the Museum’s CMS avoided the bottleneck of data ingestion into the CMS, allowing the data to be rapidly accessed through our Data Portal.
Acknowledgements
We would like to thank the following people for assistance during the Phthiraptera slide digitisation project: Paul Brown, Steen Dupont, Vladimir Blagoderov, Sam Broom, Charlotte Barclay, Darrell Siebert, Chris Sleep and Paul Ward. We thank Helen Hardy for comments on the manuscript.
Funding program
This research received support from the Museum's Digital Collection Programme and the SYNTHESYS Project (http://www.synthesys.info), which is financed by the European Community Research Infrastructure Action under the FP7 Integrating Activities Programme. This paper was written as part of our contribution to ICEDIG – “Innovation and consolidation for large scale digitisation of natural heritage” (https://icedig.eu) – an H2020 funded design study to supporting the implementation phase the DiSSCo research infrastructure (http://dissco.eu).
Grant title
SYNTHESYS Project (Grant agreement number 312253) and ICEDIG (Grant agreement number 777483).
Author contributions
E. Louise Allan: Contributed substantially to the manuscript, the design of the digitisation project, workflow design, pre-digitisation preparation of the collection and acquisition of data.
Laurence Livermore: Contributed substantially to the manuscript and the conception of the digitisation project.
Benjamin W. Price: Contributed substantially to the manuscript and the workflow design.
Olha Shchedrina: Contributed to the pre-digitisation preparation of the collection and led on slide imaging.
Vincent S. Smith: Contributed substantially to the manuscript and the conception of the digitisation project.
References
- Workflow - digitisation of microscope slides using automated processing. https://dx.doi.org/10.17504/protocols.io.vmte46n. Accessed on: 2018-12-10.
- A low cost approach to specimen level imaging of natural history microscope slides using a DSLR system.OSF Preprinthttps://doi.org/10.31219/osf.io/dvmsh
- No specimen left behind: industrial scale digitization of natural history collections.ZooKeys209:133‑146. https://doi.org/10.3897/zookeys.209.3178
- Proceedings of the 17th International Congress of Myriapodology, Krabi, Thailand.ZooKeys,741,271-82pp. https://doi.org/10.3897/zookeys.741.22284
- InvertNet: a new paradigm for digital access to invertebrate collections.ZooKeys209:165‑181. https://doi.org/10.3897/zookeys.209.3571
- Digitization of museum collections holds the potential to enhance researcher diversity.Nature Ecology & Evolution1(12):1789‑1790. https://doi.org/10.1038/s41559-017-0401-6
- The natural history production line: an industrial approach to the digitization of scientific collections.ACM Journal on Computing and Cultural Heritage8:11 pages. https://doi.org/10.1145/2644822
- Inselect: automating the digitization of natural history collections.PLOS One10(11):e0143402. https://doi.org/10.1371/journal.pone.0143402
- Digitising Kew's microscope slide collection. https://www.kew.org/blogs/kew-science/digitising-kews-microscope-slide-collection. Accessed on: 2018-6-08.
- Five task clusters that enable efficient and effective digitization of biological collections.ZooKeys209:19‑45. https://doi.org/10.3897/zookeys.209.3135
- Purvis A, Newbold T, De Palma A, Contu S, Hill SLL, Sanchez-Ortiz K, Phillips HRP, Hudson LN, Lysenko I, Börger L, Scharlemann JPW (2018) Chapter five - modelling and projecting the response of local terrestrial biodiversity worldwide to land use and related pressures: the PREDICTS project. Advances in Ecological Research.58.2-293pp. [ISBN978-0-12-813949-3]. https://doi.org/10.1016/bs.aecr.2017.12.003
- Critical comparison of 31 commercially available digital slide systems in pathology.International Journal of Surgical Pathology14(4):285‑305. https://doi.org/10.1177/1066896906292274
- Phthiraptera collection.Natural History Museumhttps://doi.org/10.5519/0096731
- On natural history collections, digitized and not: a response to Ferro and Flick.ZooKeys618:145‑158. https://doi.org/10.3897/zookeys.618.9986
- An approach to high throughput slide digitisation using image segmentation.OSF Preprints.
- Overview of telepathology, virtual microscopy, and whole slide imaging: prospects for the future.Human Pathology40(8):1057‑1069. https://doi.org/10.1016/j.humpath.2009.04.006