|
Biodiversity Data Journal : General research article
|
|
Corresponding author: Matthew Thomas Wayland (mw283@cam.ac.uk)
Academic editor: Christos Arvanitidis
Received: 23 Dec 2015 | Accepted: 01 Feb 2016 | Published: 04 Feb 2016
© 2016 Matthew Thomas Wayland.
This is an open access article distributed under the terms of the Creative Commons Attribution License (CC BY 4.0), which permits unrestricted use, distribution, and reproduction in any medium, provided the original author and source are credited.
Citation: Wayland M (2016) The Meristogram: a neglected tool for acanthocephalan systematics. Biodiversity Data Journal 4: e7606. doi: 10.3897/BDJ.4.e7606
|

|
Abstract
Background
The hooks of the acanthocephalan proboscis exhibit serial variation in size and shape. The Meristogram was developed by
New information
The Meristogram algorithm was implemented in the R language and a simple graphical user interface created to facilitate ease of use (the software is freely available from https://github.com/WaylandM/meristogram). The accuracy of the algorithm's formula for calculating hook cross-sectional area was validated by data collected using a digitizing tablet. Meristograms were created from data in public respositories for eight Echinorhynchus taxa: E. bothniensis, E. 'bothniensis', E. gadi spp. A, B and I, E. brayi, E. salmonis and E. truttae. In this preliminary analysis, the meristogram differentiated E. bothniensis, E. brayi, E. gadi sp. B, E. salmonis and E. truttae from each other, and from the remaining taxa in this study, but independent data will be required for validation. Sample sizes for E. 'bothniensis' and E. gadi spp. A and I were too small to identify diagnostic features with any degree of confidence. Meristogram differences among the sibling species of the E. gadi and E. bothniensis groups suggest that the 'intra-specfic' variation in meristogram previously reported for some Echinorhynchus taxa, may have actually represented morphological divergence between unrecognized cryptic species. Hierarchical clustering of taxa based on Meristogram data yielded dendrograms that were largely concordant with phylogenetic relationships inferred from DNA sequence data, indicating the presence of a strong phylogenetic signal.
Keywords
Echinorhynchus bothniensis, Echinorhynchus brayi, Echinorhynchus gadi, Echinorhynchus salmonis, Echinorhynchus truttae, Acanthocephala, Meristogram, proboscis, hook, morphometric, meristic, phylogeny, taxonomy, systematics, software, open-source
Introduction
Acanthocephalans are characterized by the presence of a retractable proboscis armed with recurved hooks which provides the means of attachment to the definitive host's gut wall. In many acanthocephalans the proboscis hooks are arranged in longitudinal rows and display positional variation in size and shape. The Meristogram was developed by
Presumably anticipating the adoption of the Meristogram as a taxonomic character,
All of the previous Meristogram studies were conducted before molecular markers were in widespread use and so genetic data were not collected to demonstrate reproductive isolation between populations, detect morphologically cryptic species or resolve phylogenetic relationships between taxa. Now both hook measurements and molecular data are available for a number of Echinorhynchus spp. (
- Is the Meristogram consistent with species?
- Can the Meristogram discriminate taxa, including morphologically cryptic species?
- Are hook patterns phylogenetically informative?
Additional aims of this study were to implement a freely available and easy to use software tool for creating Meristograms and to evaluate the accuracy of the algorithm's estimation of cross-sectional hook area.
Material and methods
Hook measurement data
All hook measurement data were extracted from the Dryad data repository (
Taxa analysed using the Meristogram. Data files contain hook measurement data in the appropriate format for input to the Meristogram software.
| Acanthocephalan | Host(s) | Locality | Accession Numbers | Number of Specimens | Source |
Data Files (F, female; M, male) |
|---|---|---|---|---|---|---|
| E. bothniensis | Osmerus eperlanus L. | Bothnian Bay, Baltic Sea and Lake Keitele, central Finland | BM (NH) 1987.1070–1074 (paratypes); BM (NH) 2002.2.4.102–122; BM (NH) 1989.1474–1491 |
10 (5 F, 5 M) |
|
F: M: |
| E. 'bothniensis' | Platichthys flesus (L.) | Lake Pulmankijärvi, northern Finland | NA |
2 (2 F, 0 M) |
|
|
| E. brayi | Pachycara crassiceps (Roule) | Porcupine Seabight, 49°49.9'N, 13°08.2'W, depth 2,444 m | BM(NH) 1997.12.8.3 (holotype); BM(NH) 1997.12.8.4–28 |
11 (4 F, 7 M) |
|
F: M: |
| E. gadi sp. A | Gadus morhua L. | northern North Sea | NA |
6 (4 F, 2 M) |
|
F: M: |
| E. gadi sp. B | G. morhua and Melanogrammus aeglefinus (L.) | northern North Sea | NA |
8 (4 F, 4 M) |
|
F: M: |
| E. gadi sp. I | G. morhua | Baltic Sea, off Tvärminne, Hanko | BM(NH) 2002.2.4.90–101 |
6 (5 F, 1 M) |
|
F: M: |
|
E. salmonis |
Coregonus lavaretus L. and Osmerus eperlanus (L.) |
Bothnian Bay, Baltic Sea | BMNH 2002.2.4.132-226; BMNH 2002.2.4.227-263 |
42 (36 F, 6 M) |
|
F dorsal: F ventral: M dorsal: M ventral: |
| E. truttae | Salmo trutta L. | Drummore, southwest Scotland | BM (NH) 1986.764–793 |
54 (35 F, 19 M) |
|
F: M: |
| E. truttae | S. trutta | River Carron catchment, central Scotland | BM (NH) 2002.2.4.264–275; BM (NH) 2002.2.4.276–283 |
18 (11 F, 7 M) |
|
F: M: |
Nuclear and mitochondrial DNA sequences have elucidated the phylogenetic relationships of six of these taxa: E. bothniensis Zdzitowiecki & Valtonen, 1987, E. 'bothniensis' (an allopatric, sibling species of E. bothniensis), E. brayi Wayland, Sommerville & Gibson, 1999, E. gadi sp. I (one of the sibling species of the E. gadi group identified by
Implementation of the Meristogram
For the original description of the Meristogram algorithm, please refer to
- Hook position is standardized to allow homologous regions of the proboscis to be compared across specimens with different numbers of hooks per row. Counted position number is multiplied by 100 and divided by n + 1, where n is the total number of hooks in the row and the constant 1 is a corrective factor for centring the data-points in graphs.
- Two additional variables are computed for each hook: area = length × base/2 and ratio = base × 100/length.
- Hook variables length, base, area and ratio are standardized within each row by conversion to percentages of their respective maximum value.
- A moving average routine is used to extract the trends in positional variation for each of the hook variables. The moving average routine considers a user-defined segment of the percent-position axis for each character and moves through the data from the distal end to the proximal end of the proboscis in 1% increments. With each advance of the segment, the arithmetic means of the standardized hook variables and the percent-position value are calculated for all hooks located in the segment.
- A moving average routine is used to extract the trends in positional variation for each of the hook variables. The moving average routine considers a user-defined segment of the percent-position axis for each character and moves through the data from the distal end to the proximal end of the proboscis in 1% increments. With each advance of the segment, the arithmetic means of the standardized hook variables and the percent-position value are calculated for all hooks located in the segment.
- For each hook variable, each of the segment means is multiplied by 100 and divided by the largest segment mean for that hook variable, yielding a "percent-max-collection-value".
- The percent-max-collection-values of all four hook variables are plotted against percent-position to produce the Meristogram.
The moving average routine results in a non-uniform distribution of data-points along the percent-position axis. In the current implementation of the Meristogram algorithm an optional linear interpolation procedure is introduced between steps 4 and 5. The 'approx' function in R is used to calculate hook metrics (L, B, A & R) at each integer value in the range of percent-position values yielded by the moving average routine. This linear interpolation step often improves the appearance of the Meristogram, but more importantly, by providing common percent-position coordinates it facilitates comparison of Meristograms using multivariate statistics (please see next section).
This new implementation of the Meristogram algorithm also enforces a minimum moving average segment size. It seems reasonable to argue that each proboscis in a collection should be represented in every moving average segment. The minimum moving average interval is thus defined as 100/(x+1), rounded up to the nearest integer, where n is the length of the shortest row of hooks in the collection.
The Meristogram algorithm has been implemented in R (
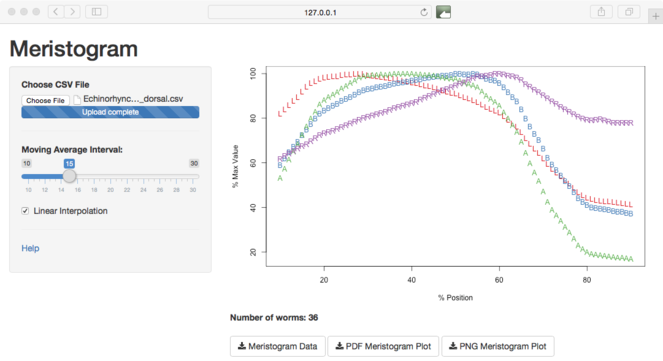
Screen-grab of the graphical user interface to the Meristogram tool. The slider control provides dynamic control of the moving average interval and linear interpolation can be toggled on/off using the checkbox. Plots and data can be downloaded using the buttons at the bottom of the screen.
Data analysis
All data analyses were performed using the R language and environment (
Before considering inter-taxon differences in Meristogram, intra-taxon variation related to sex and choice of moving average interval was investigated. For each taxon, a set of Meristograms were plotted for each sex using the following moving average segment sizes: (1) minimum moving average interval (MMAI) for the taxon; (2) 1.5 × MMAI; (3) 2 × MMAI.
To assess inter-taxon variation, hook measurement data for females and males were pooled and a Meristogram was generated for each taxon using a moving average segment of 17% and linear interpolation. For comparative purposes it was important to use the same moving average segment for all Meristograms and 17% was the MMAI which could be applied to all taxa.
In addition to visual inspection of Meristograms, a more objective comparison of Meristograms was achieved with the aid of statistical pattern recognition methods. Meristogram data from all taxa were concatenated into a single matrix, where columns were hook variables at each integer percent-position and rows were taxa. Principal component analysis (PCA) was then used to reduce the number of dimensions in this data-set. Similarity of Meristograms was further assessed by hierarchical clustering of the scores for the first two principal components (accounting for most of the variation in the data-set) using the unweighted pair group method with arithmetic mean (UPGMA) algorithm and four different distance metrics (Euclidean, Manhattan, maximum and Minkowski).
Data resources
No new data are presented in this study. However, files of hook measurement data in the appropriate format for input to the Meristogram software have been prepared and these are available as supplementary material (
Results
Estimation of hook area
Measurements of hook cross-sectional area, obtained using a digitizing tablet, were available for E. gadi spp. A, B & I. These measurements were strongly correlated with area calculated by the Meristogram (
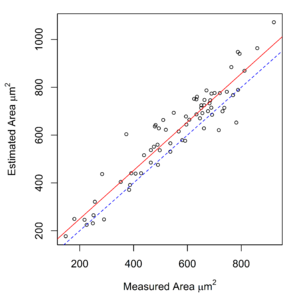
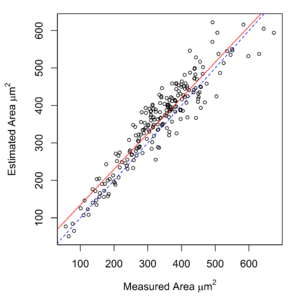
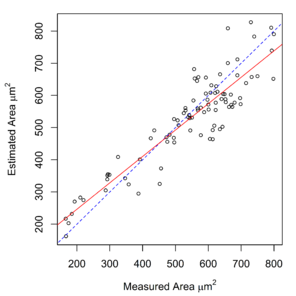
Relationship between hook area estimated by the Meristogram and hook area measured using a digitising tablet in three species of the E. gadi group. The linear regression line is solid red. The line of equality is denoted by blue dashes. Analysis based on data in
b: E. gadi sp. B. 220 hooks from 18 worms (11 females and seven males). Equation of regression line: estimated = 0.953 x measured + 39.178. R2 = 0.882.
c: E. gadi sp. I. 91 hooks from seven worms (six females and one male). Equation of regression line: estimated = 0.819 x measured + 82.640. R2 = 0.816.
Meristograms
Strong evidence of sexual dimorphism was not found in the Meristograms for E. salmonis (
The new software implementation of the Meristogram includes an optional linear interpolation step.
Meristogram of Echinorhynchus brayi. Meristograms created with a 17% moving average interval (minimum applicable to this species of acanthocephalan), using data from four females (
b: Meristogram with linear interpolation.
Meristograms for each of the taxa in this study are presented below along with a brief description. For each taxon the meristogram characteristics which differentiate it from the other taxa in the study are identified. These differences have been termed 'Potential diagnostic features', because they have yet to be validated using independent data.
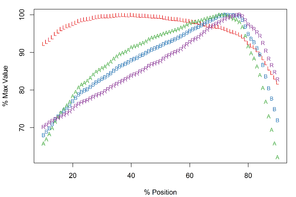
E. brayi
Description
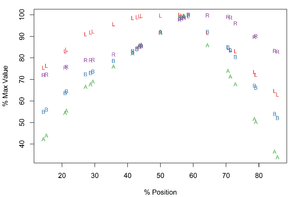
Arched pattern with maximal values for L, B, A and R at positions 55%, 58%, 58% and 59%, respectively (
Potential diagnostic features
The following features of the Meristogram of E. brayi are unique among the taxa in this study:
- The curves for all four hook variables converge at a percent-position of approximately 60% and all four variables have maximal values at this location.
- On the distal third of the proboscis the order or the curves from top to bottom is length, ratio, base, area; in the other taxa the order of these hook characters is typically length, area, base, ratio.
- The largest values of length are found in the middle of the proboscis, whereas in the other taxa maximum values of length are found towards the distal end.
- Absence of loops formed by the intersection of curves.
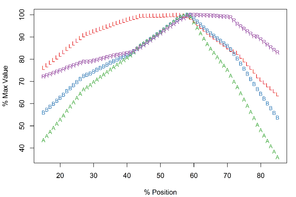
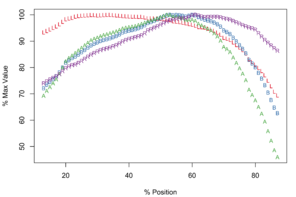
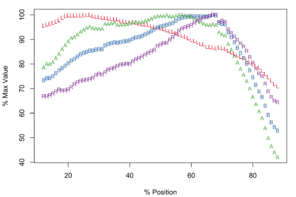
E. salmonis
Description
Of the taxa in this study, only E. salmonis is known to display radial asymmetry in proboscis armature (
Meristograms of dorsal and ventral hooks of Echinorhynchus salmonis. Meristograms generated with a moving average interval of 17% using data from 36 females (
b: Ventral
In female worms the dorsal row maxima for raw L, B, A and R had the following ranges 95.7-126.7µm, 25.5-45.5µm, 1,265-2,494µm2 and 29.1-43.8, respectively; corresponding values for ventral rows were 99.9-129.4µm, 25.7-47.2µm, 1,410-2,678µm2 and 26.9-41.7, respectively. The hooks of male worms were typically smaller with dorsal row maxima for L, B, A and R of 70.1-91.3µm, 21.7-27.7µm, 720.4-1,095.0µm2 and 31.3-39.8, respectively; and ventral row maxima of 76.9-97.5µm, 25.2-27.7µm, 896-1,278µm2 and 31.4-35.5, respectively.
There is a region of very small hooks (low values of A and L) on the dorsal surface of the proximal end of the proboscis (positions > 79%), corresponding to a flattening of the tail of the Meristogram. Length and area of the last and smallest hook in dorsal rows of female worms ranged from 34.3-59.2µm and 137-477µm2, respectively. In male worms the final hook in a dorsal row had a length of 26.4-42.1µm and an area of 94.8-242.1µm2. On the ventral surface, hooks also become much smaller proximally, but not to the extent observed on the dorsal surface. The final hook in ventral rows of female worms measured 42.8-76.8µm in length and had an area of 218-782µm2; the corresponding hook in male worms had a length of 41-62µm and an area of 211-527µm2. The smallest hooks are not the weakest; the latter are found at the distal end of the proboscis. In female worms the stoutness ratio of the first hook in a row was 15.5-25.1 on the dorsal surface of the proboscis and 12.7-23.9 on the ventral. The most distal hooks of male worms had stoutness ratios of 18.3-27.8 and 17.6-30.1 for dorsal and ventral rows, respectively.
Potential diagnostic features
- Radial asymmetry
- Hooks are markedly reduced in size at the proximal end of the proboscis, especially on the dorsal surface.
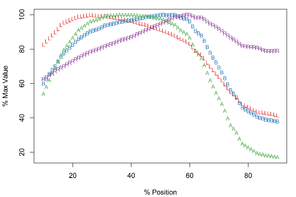
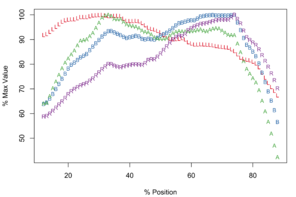
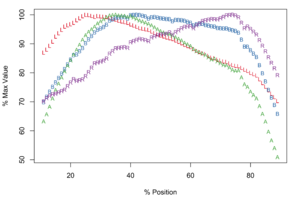
E. truttae
Description
The Meristograms of E. truttae from Drummore and the River Carron catchment display several loops; three prominent loops are shared by both collections (
Meristograms for Echinorhynchus truttae from two geographical locations: Drummore, southwest Scotland and the River Carron catchment, central Scotland. Both Meristograms generated with a moving average interval of 17%. These Meristograms are based on the following data:
- Drummore – 35 females (
Suppl. material ) and 19 males (18 Suppl. material ).19 - River Carron catchment – 11 females (
Suppl. material ) and 7 males (20 Suppl. material ).21
b: River Carron catchment, central Scotland
The Drummore collection has peak values of L, B, A and R at positions 40%, 72%, 70% and 77%, respectively (
In the collection from the River Carron catchment maximal values of L, B, A and R are found at positions 33%, 64%, 43% and 75%, respectively (
Potential diagnostic features
E. truttae exhibits the least serial variation in hook size. The shortest hooks are 80% (River Carron catchment) - 82% (Drummore) of the length of the longest hooks in their respective rows. In the other taxa studied the shortest hooks are 42-71% of the length of the longest hooks. Similarly the smallest hooks of E. truttae have an area 62% (Drummore) - 66% (River Carron catchment) that of the largest hooks, whereas in the other taxa this value ranges from 17-51%.
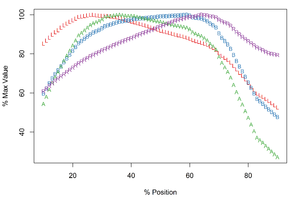
E. bothniensis
Description
The curves for B, A and R follow a similar trajectory in the distal half of the Meristogram, with a particularly strong monotonic relationship between B and A (
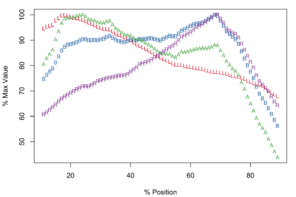
Meristograms of species of the Echinorhynchus gadi group, Echinorhynchus bothniensis group and Echinorhynchus truttae. All Meristograms generated with a moving average interval of 17%. These Meristograms are based on the following data:
-
E. bothniensis – 5 females (
Suppl. material ) and 5 males (3 Suppl. material ).4 -
E. 'bothniensis' – 2 females (
Suppl. material ).5 -
E. gadi sp. A – 4 females (
Suppl. material ) and 2 males (8 Suppl. material ).9 -
E. gadi sp. B – 4 females (
Suppl. material ) and 4 males (10 Suppl. material ).11 -
E. gadi sp. I – 5 females (
Suppl. material ) and 1 male (12 Suppl. material ).13
b: E. 'bothniensis'
c: E. gadi sp. A
d: E. gadi sp. B
e: E. gadi sp. I
The longest hooks (57.2-66.0µm in females and 50.0-60.6µm in males) are located around a third of the way along a row from the distal end of the proboscis, and the shortest hooks (30.2-42.4µm in females and 24.7-43.3µm in males) at the proximal end of a row. The stoutest hooks (ratio values of 35.8-39.0 in females and 32.0-35.0 in males) are found just proximal to the middle of the row and the weakest (20.7-24.2 in females and 20.8-28.9 in males) at the distal end of the row. The hooks with the broadest base (18.7-22.5µm in females and 16.1-19.5µm in males) and greatest area (507-676µm2 in females and 393-547µm2 in males) are located in the middle of the row.
Potential diagnostic features
Apparently unique characteristics for this Meristogram are:
- Similar curves for A, B and R in distal half of the Meristogram, with B and A almost superimposed.
- Absence of large loops. Only two prominent loops, both of which are very narrow relative to those displayed in the Meristograms of the other taxa.
E. 'bothniensis'
Description
The Meristogram of E. 'bothniensis' (
Potential diagnostic features
The Meristogram for E. 'bothniensis' was created using data from just two specimens; additional data may well change the appearance of the Meristogram. For this reason diagnostic characters have not been proposed for this taxon.
E. gadi sp. A
Description
Maximal values of L, B, A and R occur at positions: 27%, 67%, 57% and 67% (
Potential diagnostic features
E. gadi sp. A is one of only three taxa in this study with a Meristogram in which none of the curves intersect at the distal end of the proboscis; the others are E. gadi sp. I and E. brayi. Differences in the shape of the curve for A might separate E. gadi sp. A from E. gadi sp. I, however given the small sample sizes for these two collections of worms, this diagnostic may not be robust. Moreover, there is tentative evidence that these two taxa are conspecific (
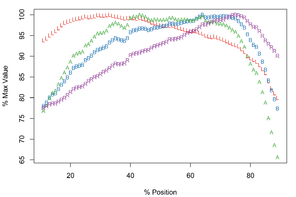
E. gadi sp. B
Description
The Meristogram of E. gadi sp. B possesses three prominent loops: a distal loop bordered above by B and L, and below by R; a loop mid-way along the proboscis bordered above by B, and below by A and R; a proximal loop bordered above by R and B, and below by A and L (
The Meristograms of all of the E. gadi spp. in this study, broadly display what
Potential diagnostic features
E. gadi sp. B is the only taxon in this study in which the hook variable B peaks on the distal half of the proboscis.
E. gadi sp. I
Description
In the 45-80% position region of the Meristogram are three obvious loops (
Potential diagnostic features
Meristogram characteristics which may differentiate E. gadi sp. I and A from the other taxa in this study have been described in the section on E. gadi sp. A (above).
Clustering taxa on Meristogram similarity
Visual inspection of Meristograms reveals some similarities and differences between taxa. For a more objective comparison, statistical pattern recognition was used to measure Meristogram divergence between taxa. In this analysis, a single Meristogram was generated for E. salmonis by pooling hook measurement data from dorsal and ventral rows of hooks; the hook measurement data from the other taxa were assumed to comprise a mixture of dorsal and ventral rows of hooks. The two collections of E. truttae were treated as separate entities, because of the divergence observed between their Meristograms (
Principal component analysis (PCA) revealed the major sources of variation in the Meristograms.
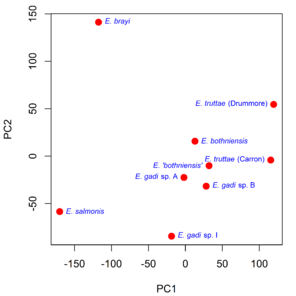
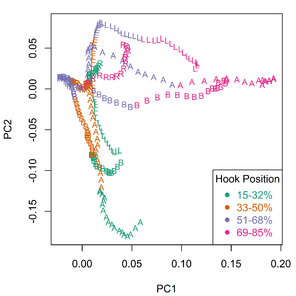
Principal component analysis of Meristograms. The first (PC1) and second (PC2) principal components describe 56% and 27% of the variance in the data, respectively. Meristograms were generated from hook measurement data in
b: Scatterplot of the loadings for the first two principal components (PC1 and PC2). Hook variables (L, B, A and R) are colour coded to indicate standardized position (%).
Hierarchical clustering of the scores for the first two PCs depicts relationships between Meristograms as a dendrogram (
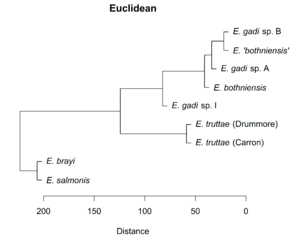
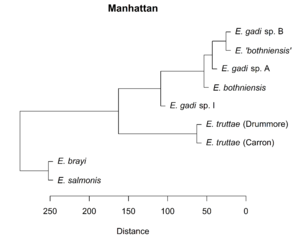
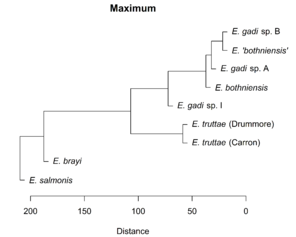
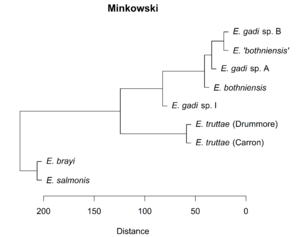
Dendrograms showing the relationships between Meristograms for the Echinorhynchus taxa. A principal component analysis was applied to the Meristogram data and the dendrograms were created from hierarchical clustering of the scores for principal components one and two. Hierarchical clustering was performed using the Unweighted Pair Group Method with Arithmetic Mean (UPGMA) agglomeration method, applied to each of four different distance metrics: Euclidean, Manhattan, maximum and Minkowski. Analysis based on hook measurement data in
b: UPGMA clustering using Manhattan distance metric.
c: UPGMA clustering using maximum distance metric.
d: UPGMA clustering using Minkowski distance metric.
Discussion
Intraspecific variation
The differences in Meristogram between the central and southwest Scotland collections of E. truttae suggest intraspecific, geographical variation in hook patterns. However, given the existence of cryptic species in Echinorhynchus (Väinölä et al. 1994), the alternative explanation of interspecific variation should also be considered. Despite this subtle difference in Meristogram, the two populations of E. truttae displayed a much stronger affinity to each other, than to any of the other taxa in all cluster analyses (
Discrimination of taxa
None of the eight Echinorhynchus taxa in this study appear to share identical Meristograms, based on the available hook measurement data. However, sample sizes were small (six or fewer specimens for E. 'bothniensis' and E. gadi spp. A and I) and so very unlikely to encompass the range of morphological variation potentially displayed by these taxa. Such variation might render some of the proposed diagnostics ineffectual, particularly for the discrimination of the closely related E. truttae, E. gadi spp, E. bothniensis and E. 'bothniensis'.
Not surprisingly, Meristogram analysis appeared to be most effective at discriminating taxa for which conventional characters are diagnostic, such as E. brayi, E. salmonis and E. truttae; these are also the taxa showing the greatest genetic divergence (
Morphology and ecology suggest that the NE Atlantic E. brayi is closely related to E. canyonensis from the Monterey Submarine Canyon in the Pacific (
Phylogenetic signal
Hierarchical clustering shows relationships between taxa based on overall similarity (
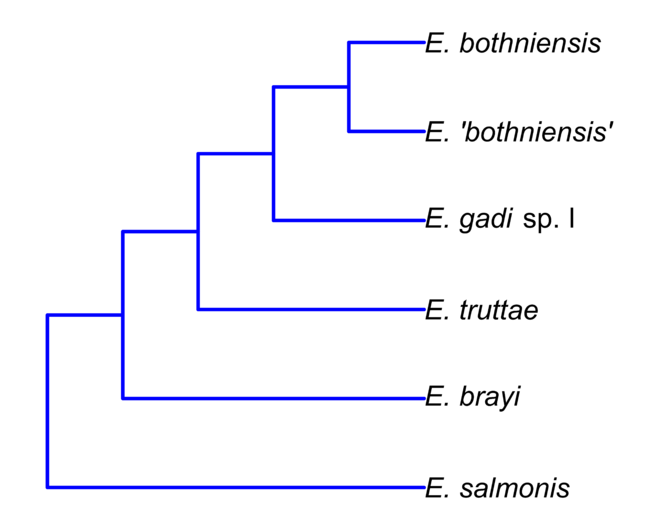
Phylogenetic relationships of six of the Echinorhynchus taxa in this study inferred from nuclear ribosomal and mitochondrial DNA sequences (
Concordance between the dendrograms and the molecular phylogeny is evidence of a strong phylogenetic signal in the Meristogram. This raises the prospect of using Meristogram characteristics to define monophyletic groups within Echinorhynchus and thus facilitate a revision of this large and expanding genus. However, distillation of discrete character states suitable for taxonomy, from the continuous variables that comprise the Meristogram, is likely to be a significant challenge.
Practical considerations
The formula used by the Meristogram for estimating hook cross-sectional area has been shown to be accurate. However, since hook metrics are standardized, estimates of hook area are only required to be proportional to the actual area. Although no evidence of sexual dimorphism was found in this study, users of the Meristogram should be alert to this possible source of intra-specific variation. In E. truttae females tend to have slightly larger hooks than males (
Meristograms have been shown to be sensitive to the choice of moving average interval and so in comparative studies it is important to use the same value of this parameter for all hook collections. The systematic homogeneity of a sample of acanthocephalans should be assessed before applying the Meristogram. Molecular markers are the first choice of tool for detecting cryptic species, but when they cannot be applied, the Proboscis Profiler (
Users of the Meristogram are encouraged to share their hook measurement data, either by including them as supplementary files to publications or submitting them to public repositories (e.g. Dryad, Zenodo, etc.). In addition to facilitating further comparative analyses, these datasets are potentially useful in the testing and refinement of the Meristogram algorithm.
Final comments
Having demonstrated the utility of the Meristogram in acanthocephalan systematics, the author is keen to facilitate its use. Free software is provided for systematists who would like to apply the technique themselves. Additionally, the author would welcome the opportunity to analyse hook morphometric data for other acanthocephalan workers as part of a collaborative project.
The Meristogram is not limited to the analysis of the hooks of the acanthocephalan proboscis. It can potentially be applied to any organism in which there are patterns in the longitudinal variation of serially homologous structures, e.g. "the taxonomic diagnosis of the vegetative characters of plants when fruiting structures are not available; species-level diagnosis of feather structures in fragments encountered in gut contents (or poacher's clothing), etc." (Professor David Huffman, personal communication, July 7, 2010). The freely available source code for the current implementation of the Meristogram should provide a helpful starting point for anyone who would like to adapt the method for novel applications.
Author contributions
The author would like to thank the reviewers, Drs David Huffman and Scott Monks, for their constructive comments which greatly improved this paper.
References
-
The effect of host species on growth and variability of Echinorhynchus salmonis Müller, 1784 (Acanthocephala: Echinorhynchidae), with special reference to the status of the genus.Systematic Parasitology2(1):9‑20. DOI: 10.1007/bf00015091
-
Echinorhynchus indicus n. sp., an acanthocephalan parasite of marine fish, Pomadasys maculatus (Bloch), from Waltair Coast.Indian Journal of Parasitology6(2):255‑257.
-
shiny: Web Application Framework for R.0.12.1. URL: http://CRAN.R-project.org/package=shiny
-
[Echinorhynchus theragrae sp. n. (Acanthocephala: Echinorhynchidae) a parasite of Theragra chalcogramma from the Sea of Japan].Parazitologiya26:267‑269. [InRussian].
-
Meristogram Analysis of a Collection of Pomphorhynchus bulbocolli from South-Central Kentucky.The Journal of Parasitology67(1):133‑134. DOI: 10.2307/3280800
-
Echinorhynchus canyonensis sp. n. (Acanthocephala) from Maynea californica (Osteichthyes: Zoarcidae) from the Monterey Submarine Canyon, California.Proceedings of the Helminthological Society of Washington 44(2)44(2):171‑176.
-
Meristogram Analysis of the Acanthocephalan Genus Pomphorhynchus in North America.The Journal of Parasitology64(5):851‑859. DOI: 10.2307/3279516
-
Meristograms: Graphical Analysis of Serial variation of Proboscis Hooks of Echinorhynchus (Acanthocephala).Systematic Biology24(3):333‑345. DOI: 10.1093/sysbio/24.3.333
-
[Echinorhynchus sebastolobi sp. n. (Acanthocephala, Echinorhynchidae) an intestinal parasite of sea perch].Parazitologiya20:157‑159. [InRussian].
-
[Notes on the parasites of the carp of Qinhai Hu].Journal of Fisheries of China5:295‑299. [InChinese].
-
[New species of thorny-headed worms from Palaeacanthocephala Meyer, 1931 from fishes of the Indian Ocean and South Atlantic].Ekologiya Morya, Kiev20:26‑29. [InRussian].
-
R: A Language and Environment for Statistical Computing.3.2.2.R Foundation for Statistical Computing. Release date:2015 8 14. URL: https://www.R-project.org
-
[New representatives of the genus Metechinorhynchus (Acanthocephala), parasites of fishes of the western Antarctic].Zoologicheskii Zhurnal6:1893‑1896. [InRussian].
-
[New species of Acanthocephala of the genus Echinorhynchus (Echinorhynchidae) from the southwestern Atlantic].Parazitologiya20:224‑227. [InRussian].
-
Morphological variability in Echinorhynchus gadi, E. leidyi, and E. salmonis (Acanthocephala: Echinorhynchidae) from fishes in northern Canadian waters.Canadian Journal of Zoology64(4):985‑995. DOI: 10.1139/z86-148
-
Echinorhynchus lesteri n.sp. (Acanthocephala:Echinorhynchidae) Parasitic in the Intestine of the Orange Roughy Hoplostethus Atlandicus.Transactions of the Royal Society of South Australia136(1):50‑55.
-
Molecular systematics in the acanthocephalan genus Echinorhynchus (sensu lato) in northern Europe.Parasitology108(1):105. DOI: 10.1017/s0031182000078574
-
Proboscis profiler: a tool for detecting acanthocephalan morphotypes.Systematic Parasitology76(3):159‑167. DOI: 10.1007/s11230-010-9245-z
-
Morphological variation in Echinorhynchus truttae Schrank, 1788 and the E. bothniensis Zdzitowiecki & Valtonen, 1987 species complex from freshwater fishes of northern Europe.Biodiversity Data Journal1:e975. DOI: 10.3897/bdj.1.e975
-
Echinorhynchus trachyrinci n. sp. (Acanthocephala: Echinorhynchidae) from macrourid fishes of the northeast Atlantic.Systematic Parasitology37(1):59‑66. DOI: 10.1023/a:1005776015391
-
Echinorhynchus salmonis Müller, 1784 (Acanthocephala: Echinorhynchidae) from the Bothnian Bay, Baltic Sea: morphological variability and radial asymmetry of proboscis hooks.Systematic Parasitology58(2):149‑158. DOI: 10.1023/b:sypa.0000029419.07989.1a
-
Morphometric discrimination of two allozymically diagnosed sibling species of the Echinorhynchus gadi Zoega in Müller complex (Acanthocephala) in the North Sea.Systematic Parasitology60(2):139‑149. DOI: 10.1007/s11230-004-1388-3
-
Data from: Echinorhynchus salmonis Müller, 1784 (Acanthocephala: Echinorhynchidae) from the Bothnian Bay, Baltic Sea: morphological variability and radial asymmetry of proboscis hooks.Dryad Digital RepositoryNA:NA. DOI: 10.5061/DRYAD.V21K1
-
Data from: Morphometric discrimination of two allozymically diagnosed sibling species of the Echinorhynchus gadi Zoega in Müller complex (Acanthocephala) in the North Sea.Dryad Digital RepositoryNA:NA. DOI: 10.5061/DRYAD.HD5C7
-
Echinorhynchus brayi n. sp. (Acanthocephala: Echinorhynchidae) from Pachycara crassiceps (Roule) (Zoarcidae), a deep-sea fish.Systematic Parasitology43(2):93‑101. DOI: 10.1023/a:1006185613402
-
Data from: Echinorhynchus brayi n. sp. (Acanthocephala: Echinorhynchidae) from Pachycara crassiceps (Roule) (Zoarcidae), a deep-sea fish.Dryad Digital RepositoryNA:NA. DOI: 10.5061/DRYAD.62285
-
The systematics of Echinorhynchus Zoega in Müller, 1776 (Acanthocephala, Echinorhynchidae) elucidated by nuclear and mitochondrial sequence data from eight European taxa.ZooKeys484:25‑52. DOI: 10.3897/zookeys.484.9132
-
Echinorhynchus nototheniae sp. n. (Acanthocephala) from nototheniid fishes from the environs of the South Shetlands (Antarctic).Acta Parasitologica Polonica31:23‑27.
-
Description of Echinorhynchus bothniensis sp. n. (Acanthocephala), a parasite of smelt Osmerus eperlanus L. in Bothnian Bay.Acta Parasitologica Polonica32(3):233‑238.
Supplementary materials
The commands in this script will perform all of the data analyses described in this paper and generate all of the figures. The script is included here to enable readers to verify the findings of this study.
Download file (33.41 kb)
Comma separated value file with the following nine columns: species, sex, specimen, hook, position, length, base, measured_area and estimated_area.
species - species of the E. gadi group (A, B or I)
sex - sex of acanthocephalan
hook - numerical position of hook in longitudinal row as counted from the distal end of the proboscis
length - length of hook blade (micrometres)
base - width of hook base (micrometres)
measured_area - cross-sectional area (square micrometres) of a hook viewed in profile and measured using a digitising tablet
estimated_area - cross-sectional area (square micrometres) of hook estimated using the formula: area = length x base / 2
Download file (16.58 kb)
The file is a comma separated value (CSV) format suitable for input to the Meristogram software. The file has four columns: specimen, hook, length, base.
specimen - unique identifier for the specimen
hook - numerical position of hook in longitudinal row as counted from the distal end of the proboscis
length - length of hook blade (micrometres)
base - width of hook base (micrometres)
Source: Wayland (2013)
Download file (1.19 kb)
The file is a comma separated value (CSV) format suitable for input to the Meristogram software. The file has four columns: specimen, hook, length, base.
specimen - unique identifier for the specimen
hook - numerical position of hook in longitudinal row as counted from the distal end of the proboscis
length - length of hook blade (micrometres)
base - width of hook base (micrometres)
Source: Wayland (2013)
Download file (1.18 kb)
The file is a comma separated value (CSV) format suitable for input to the Meristogram software. The file has four columns: specimen, hook, length, base.
specimen - unique identifier for the specimen
hook - numerical position of hook in longitudinal row as counted from the distal end of the proboscis
length - length of hook blade (micrometres)
base - width of hook base (micrometres)
Source: Wayland (2013)
Download file (550.00 bytes)
The file is a comma separated value (CSV) format suitable for input to the Meristogram software. The file has four columns: specimen, hook, length, base.
specimen - unique identifier for the specimen
hook - numerical position of hook in longitudinal row as counted from the distal end of the proboscis
length - length of hook blade (micrometres)
base - width of hook base (micrometres)
Download file (428.00 bytes)
The file is a comma separated value (CSV) format suitable for input to the Meristogram software. The file has four columns: specimen, hook, length, base.
specimen - unique identifier for the specimen
hook - numerical position of hook in longitudinal row as counted from the distal end of the proboscis
length - length of hook blade (micrometres)
base - width of hook base (micrometres)
Download file (827.00 bytes)
The file is a comma separated value (CSV) format suitable for input to the Meristogram software. The file has four columns: specimen, hook, length, base.
specimen - unique identifier for the specimen
hook - numerical position of hook in longitudinal row as counted from the distal end of the proboscis
length - length of hook blade (micrometres)
base - width of hook base (micrometres)
Download file (938.00 bytes)
The file is a comma separated value (CSV) format suitable for input to the Meristogram software. The file has four columns: specimen, hook, length, base.
specimen - unique identifier for the specimen
hook - numerical position of hook in longitudinal row as counted from the distal end of the proboscis
length - length of hook blade (micrometres)
base - width of hook base (micrometres)
Download file (435.00 bytes)
The file is a comma separated value (CSV) format suitable for input to the Meristogram software. The file has four columns: specimen, hook, length, base.
specimen - unique identifier for the specimen
hook - numerical position of hook in longitudinal row as counted from the distal end of the proboscis
length - length of hook blade (micrometres)
base - width of hook base (micrometres)
Download file (1.01 kb)
The file is a comma separated value (CSV) format suitable for input to the Meristogram software. The file has four columns: specimen, hook, length, base.
specimen - unique identifier for the specimen
hook - numerical position of hook in longitudinal row as counted from the distal end of the proboscis
length - length of hook blade (micrometres)
base - width of hook base (micrometres)
Download file (1007.00 bytes)
The file is a comma separated value (CSV) format suitable for input to the Meristogram software. The file has four columns: specimen, hook, length, base.
specimen - unique identifier for the specimen
hook - numerical position of hook in longitudinal row as counted from the distal end of the proboscis
length - length of hook blade (micrometres)
base - width of hook base (micrometres)
Download file (1.45 kb)
The file is a comma separated value (CSV) format suitable for input to the Meristogram software. The file has four columns: specimen, hook, length, base.
specimen - unique identifier for the specimen
hook - numerical position of hook in longitudinal row as counted from the distal end of the proboscis
length - length of hook blade (micrometres)
base - width of hook base (micrometres)
Download file (314.00 bytes)
The file is a comma separated value (CSV) format suitable for input to the Meristogram software. The file has four columns: specimen, hook, length, base.
specimen - unique identifier for the specimen
hook - numerical position of hook in longitudinal row as counted from the distal end of the proboscis
length - length of hook blade (micrometres)
base - width of hook base (micrometres)
Download file (7.31 kb)
The file is a comma separated value (CSV) format suitable for input to the Meristogram software. The file has four columns: specimen, hook, length, base.
specimen - unique identifier for the specimen
hook - numerical position of hook in longitudinal row as counted from the distal end of the proboscis
length - length of hook blade (micrometres)
base - width of hook base (micrometres)
Download file (7.49 kb)
The file is a comma separated value (CSV) format suitable for input to the Meristogram software. The file has four columns: specimen, hook, length, base.
specimen - unique identifier for the specimen
hook - numerical position of hook in longitudinal row as counted from the distal end of the proboscis
length - length of hook blade (micrometres)
base - width of hook base (micrometres)
Download file (1.17 kb)
The file is a comma separated value (CSV) format suitable for input to the Meristogram software. The file has four columns: specimen, hook, length, base.
specimen - unique identifier for the specimen
hook - numerical position of hook in longitudinal row as counted from the distal end of the proboscis
length - length of hook blade (micrometres)
base - width of hook base (micrometres)
Download file (1.18 kb)
The file is a comma separated value (CSV) format suitable for input to the Meristogram software. The file has four columns: specimen, hook, length, base.
specimen - unique identifier for the specimen
hook - numerical position of hook in longitudinal row as counted from the distal end of the proboscis
length - length of hook blade (micrometres)
base - width of hook base (micrometres)
Source: Wayland (2013)
Download file (9.99 kb)
The file is a comma separated value (CSV) format suitable for input to the Meristogram software. The file has four columns: specimen, hook, length, base.
specimen - unique identifier for the specimen
hook - numerical position of hook in longitudinal row as counted from the distal end of the proboscis
length - length of hook blade (micrometres)
base - width of hook base (micrometres)
Source: Wayland (2013)
Download file (5.21 kb)
The file is a comma separated value (CSV) format suitable for input to the Meristogram software. The file has four columns: specimen, hook, length, base.
specimen - unique identifier for the specimen
hook - numerical position of hook in longitudinal row as counted from the distal end of the proboscis
length - length of the hook blade (micrometres)
base - width of the hook base (micrometres)
Source: Wayland (2013)
Download file (2.89 kb)
The file is a comma separated value (CSV) format suitable for input to the Meristogram software. The file has four columns: specimen, hook, length, base.
specimen - unique identifier for the specimen
hook - numerical position of hook in longitudinal row as counted from the distal end of the proboscis
length - length of the hook blade (micrometres)
base - width of the hook base (micrometres)
Source: Wayland (2013)
Download file (1.76 kb)
Meristograms for five female and five male specimens of Echinorhynchus bothniensis. For each sex Meristograms were generated with the following moving average intervals: 9, 14 and 18%. These intervals correspond to the minimum moving average interval (MMAI) for this collection of worms, 1.5 x MMAI and 2.0 x MMAI, respectively.
Download file (19.98 kb)
Meristograms for two female specimens of Echinorhynchus brayi, generated with the following moving average intervals: 8, 12 and 16%. These intervals correspond to the minimum moving average interval (MMAI) for this collection of worms, 1.5 x MMAI and 2.0 x MMAI, respectively.
Download file (12.02 kb)
Meristograms for four female and seven male specimens of Echinorhynchus brayi. For each sex Meristograms were generated with the following moving average intervals: 17, 26 and 34%. These intervals correspond to the minimum moving average interval (MMAI) for this collection of worms, 1.5 x MMAI and 2.0 x MMAI, respectively.
Download file (17.98 kb)
Meristograms for four female and two male specimens of Echinorhynchus gadi sp. A. For each sex Meristograms were generated with the following moving average intervals: 9, 14 and 18%. These intervals correspond to the minimum moving average interval (MMAI) for this collection of worms, 1.5 x MMAI and 2.0 x MMAI, respectively.
Download file (20.33 kb)
Meristograms for four female and four male specimens of Echinorhynchus gadi sp. B. For each sex Meristograms were generated with the following moving average intervals: 8, 12 and 16%. These intervals correspond to the minimum moving average interval (MMAI) for this collection of worms, 1.5 x MMAI and 2.0 x MMAI, respectively.
Download file (20.54 kb)
Meristograms for five female and one male specimens of Echinorhynchus gadi sp. I. For each sex Meristograms were generated with the following moving average intervals: 8, 12 and 16%. These intervals correspond to the minimum moving average interval (MMAI) for this collection of worms, 1.5 x MMAI and 2.0 x MMAI, respectively.
Download file (20.76 kb)
Meristograms for 36 female and 6 male specimens of Echinorhynchus salmonis. For each sex and proboscis surface (dorsal and ventral) Meristograms were generated with the following moving average intervals: 10, 15 and 20%. These intervals correspond to the minimum moving average interval (MMAI) for this collection of worms, 1.5 x MMAI and 2.0 x MMAI, respectively.
Download file (36.13 kb)
Meristograms for Echinorhynchus truttae from two different geographical locations: Drummore, southwest Scotland (35 females and 19 males) and the River Carron catchment, central Scotland (11 females and 7 males). For each sex and locality Meristograms were generated with the following moving average intervals: 10, 15 and 20%. These intervals correspond to the minimum moving average interval (MMAI) for this collection of worms, 1.5 x MMAI and 2.0 x MMAI, respectively.
Download file (36.61 kb)