|
Biodiversity Data Journal :
Software Description
|
|
Corresponding author:
Academic editor: Vasilis Gerovasileiou
Received: 03 Mar 2016 | Accepted: 04 Jun 2016 | Published: 01 Nov 2016
© 2016 Constantinos Varsos, Theodore Patkos, Anastasis Oulas, Christina Pavloudi, Alexandros Gougousis, Umer Ijaz, Irene Filiopoulou, Nikolaos Pattakos, Edward Vanden Berghe, Antonio Fernández-Guerra, Sarah Faulwetter, Eva Chatzinikolaou, Evangelos Pafilis, Chryssoula Bekiari, Martin Doerr, Christos Arvanitidis
This is an open access article distributed under the terms of the Creative Commons Attribution License (CC BY 4.0), which permits unrestricted use, distribution, and reproduction in any medium, provided the original author and source are credited.
Citation:
Varsos C, Patkos T, Oulas A, Pavloudi C, Gougousis A, Ijaz U, Filiopoulou I, Pattakos N, Vanden Berghe E, Fernández-Guerra A, Faulwetter S, Chatzinikolaou E, Pafilis E, Bekiari C, Doerr M, Arvanitidis C (2016) Optimized R functions for analysis of ecological community data using the R virtual laboratory (RvLab). Biodiversity Data Journal 4: e8357. https://doi.org/10.3897/BDJ.4.e8357
|
|
Abstract
Background
Parallel data manipulation using R has previously been addressed by members of the R community, however most of these studies produce ad hoc solutions that are not readily available to the average R user. Our targeted users, ranging from the expert ecologist/microbiologists to computational biologists, often experience difficulties in finding optimal ways to exploit the full capacity of their computational resources. In addition, improving performance of commonly used R scripts becomes increasingly difficult especially with large datasets. Furthermore, the implementations described here can be of significant interest to expert bioinformaticians or R developers. Therefore, our goals can be summarized as: (i) description of a complete methodology for the analysis of large datasets by combining capabilities of diverse R packages, (ii) presentation of their application through a virtual R laboratory (RvLab) that makes execution of complex functions and visualization of results easy and readily available to the end-user.
New information
In this paper, the novelty stems from implementations of parallel methodologies which rely on the processing of data on different levels of abstraction and the availability of these processes through an integrated portal. Parallel implementation R packages, such as the pbdMPI (Programming with Big Data – Interface to MPI) package, are used to implement Single Program Multiple Data (SPMD) parallelization on primitive mathematical operations, allowing for interplay with functions of the vegan package. The dplyr and RPostgreSQL R packages are further integrated offering connections to dataframe like objects (databases) as secondary storage solutions whenever memory demands exceed available RAM resources.
The RvLab is running on a PC cluster, using version 3.1.2 (2014-10-31) on a x86_64-pc-linux-gnu (64-bit) platform, and offers an intuitive virtual environmet interface enabling users to perform analysis of ecological and microbial communities based on optimized vegan functions.
A beta version of the RvLab is available after registration at: https://portal.lifewatchgreece.eu/
Keywords
Parallel data manipulation, R, pbdMPI package, Single Program Multiple Data (SPMD) parallelization, virtual enviroment, vegan package, biodiversity analyses, ecological analyses
Introduction
The advent of interdisciplinary science fields like computational ecology/biodiversity and metagenomics (
On the other hand, computer scientists are well-aware of tools, methods and implementations that can provide significant boosts in speed for computational calculations and further solve issues like memory exhaustion, a problem often faced in analyses using “big” data.
In this work, we have brought together expert scientists from the disciplines of environmental ecology and microbiology with IT and mathematical experts in order to focus on optimization methods for widely used statistical functions, effective in environmental ecology today. More specifically, we focus on the vegan (Community Ecology) package (
Similar efforts, as in
Our main incentive is to make optimization tasks easily available to the average user who has no expertise and prior training in this area of research. This way, environmental ecologists can make use of optimized functions, implemented by IT experts and mathematicians, through a freely available, user-friendly interface, without having to spend time analysing parallelization complexity and deciding on which function to use and how to do so. In addition, multiple non-parallelized functions are also available for users with no programming experience via the RvLab interface. Source code and methodologies are accessible to users with programming and IT knowledge.
We describe the optimization methods and their implementation in detail and highlight the advantages of using our optimized R functions, with respect to both computational time speed-up, as well as improved memory manipulation in order to avoid memory exhaustion issues. The analyses we focus on can be computationally demanding primarily due to large matrix operations, increasing permutations in likelihood function computations and iterative basic mathematical operations.
Motivation and State-of-the-Art
Despite its popularity among the research community, R still seems inflexible in fully exploiting the latest developments in computer software and hardware. As there are no inherent constructs for parallelizing computations, it is up to the developer to adapt the R code, in order to take advantage of the resources available by multi-core CPUs. Moreover, when the data computed are too big to fit in main memory, no simple solution is considered standard. Packages that offer workarounds are indeed available, but their use by non-expert R users is rarely considered straightforward. These are real issues faced by researchers, whose needs for processing collected data continually increase both in computational demand and in size.
Working with large datasets in R can be cumbersome because of the need to keep objects in physical memory. The need to keep whole objects in memory becomes a challenging task to those who might want to work interactively with large datasets. Several packages attempt to overcome problems when accessing big volumes of data. The bigmem package (
The Programming with Big Data in R (pbdR) project (
Nowadays, the dplyr package (
As far as parallelization is concerned, a multitude of packages have emerged, such as snow (
After considering the benefits offered, we decided to adopt pbdMPI (
Summarizing, the work conducted in the context of the project aims at applying optimization techniques for data on two different levels of abstraction described in detail in the project description. This is done by:
1) Using the pbdMPI package to implement Single Program Multiple Data (SPMD) parallelization on primitive mathematical operations, allowing for interplay with functions of the vegan package.
2) Using the dplyr and RPostgreSQL packages in order to offer secondary storage solutions whenever memory demands exceed available RAM resources (memory exhaustion)
Option (1) may be employed in conjugation with option (2) to address memory exhaustion issues. While, for speed-up and job segmentation issues we only use option (1).
We finally evaluate our optimization results using two test case scenarios with real data obtained from environmental ecologists in the standard file formats, commonly utilized in the field. We also demonstrate results and visualization outcomes obtained through the graphical user interface available through the LifeWatchGreece portal.
Project description
The general architecture design to approach the development of the LifeWatchGreece RvLab is presented in Fig.
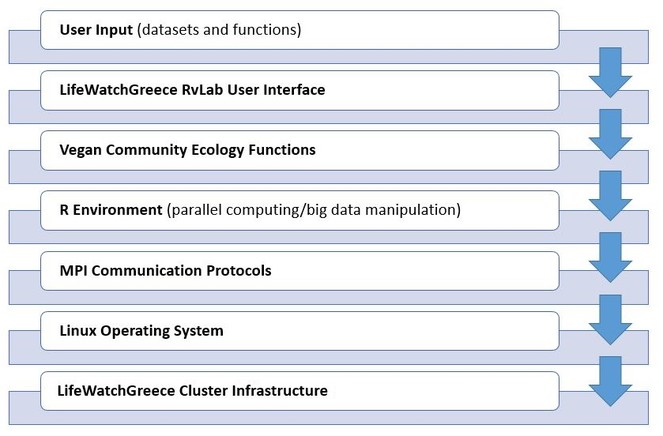
Each R script communicates with the cluster using the MPI message-passing protocol. RvLab abstracts the implementation details from the end-user: each vegan function implemented for execution within the RvLab takes advantage of the appropriate R packages for parallel computing and big data manipulation, which are preconfigured to adapt to the workload of the cluster at each particular moment.
An intuitive User Interface provides all necessary facilities for end users to perform ordinary tasks, such as to upload their datasets, to choose and parameterize the desirable vegan functions available by the RvLab, to monitor the progress of execution of their submitted jobs, and to visualize and download the produced results.
Optimization Analysis Process
The core functionalities of the RvLab lie in the middle layers of this architecture, namely in the way the vegan functions become appropriately adapted for execution within the LifeWatchGreece Cluster Infrastructure. We next describe first the general approach followed for each individual vegan function, in order to determine the optimization techniques that should be followed and then we explain in detail our generic methodology for optimizing functions.
Optimization methods focus on three major processes: a) Parallelization, b) Data manipulation through primary and secondary storage and c) Load balancing.
We focus on the parallelization of functions at two levels of abstraction: Level 1 (low level) - Primitive operations like outer product, matrix multiplication, etc, available in the core R package, are addressed at low level using basic mathematical operations, due to their frequent usage. Level 2 (high level) - More, general R functions, like those in vegan CRAN package are addressed at the higher level of abstraction, namely job segmentation. Both levels can be combined to reach optimal solutions and achieve significant speed-up. Often the output of a certain function can be utilized as the input of another functions. For such sucessive function executions, level 2 parallelization allows for efficent data portability between functions. (eg. taxa2dist -> taxondive).
Some issues which we needed to address for this work entailed the general nature of R as a programing language. R is a single-threaded language, so we had to find alternative methods to overcome memory barriers and perform big data segmentation, as well as perform task segmentation using the multi-core system available by a cluster computing environment.
The above issues were addressed primarily using MPI. MPI is a powerful, low-level tool that can provide numerous solutions for R parallelization. It provides a framework for managing communications, while the general process for utilizing MPI in SPMD (Single Program Multiple Data) can be summarized with the following steps: i) Initialize communicator(s), ii) Data input to individual processes, iii) Perform computations, iv) Communicate results, v) Shut down the communicator(s).
In order to perform MPI manipulation for RvLab we adopted pbdMPI as our primary package and couple it with other parallelization solutions or code optimization. MPI is simplified through pbdMPI, whereby a single program is written and later spawned by mpirun. pbdMPI allows for spawning and broadcasting from within R under a simplified API for all functions, permitting very fast communication.
Moreover, we utilized pbdR for big memory manipulations and in conjunction with pbdMPI we achieve low-level and custom parallel solutions and also allows us to benefit from Single Program Multiple Data.
Performing profiling techniques
In order to profile for bottlenecks (parts of the algorithm where large amounts of runtime are consumed and greater size of memory is allocated) we combine a variety of functions from several profiling packages, like profr (
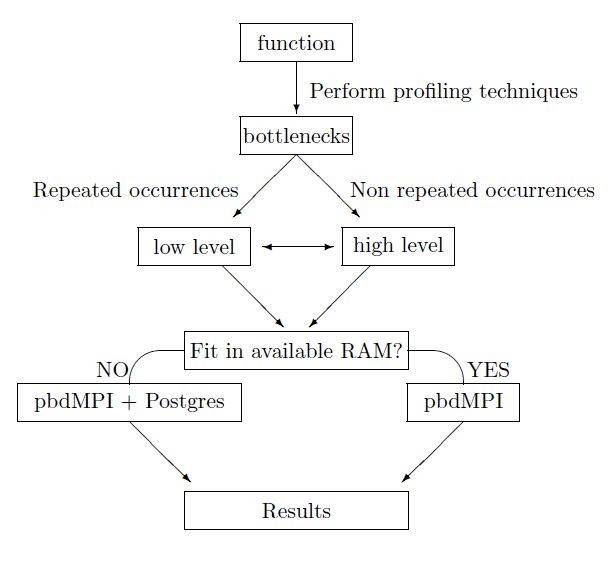
Optimization steps and approach
Before starting our parallelization methodology, we perform some preliminary tasks in order to distribute efficiently our effort. The first task concerns the application of profiling techniques so as to detect chunks of the algorithm according to memory consumption and computational time. Thereafter, we classify these chunks from most to least demanding. The second task requires categorization of these chunks according to their repetitions inside the code. Functions which contain repeated parts, like often usage of primitive functions, must be treated differently than functions with non-repeated occurances. A choice of low (level 1) or high (level 2) level optimization is then taken depending on whether the function contains repeated occurrences of primitive function operations or non-repeated occurrences, where parallelization of the functions is performed.
The next checkpoint in the workflow depends on whether the size of the data generated by the function operations exceeds the available system RAM capacity. If the data surpasses the available RAM, we use RPostgreSQL and dplyr packages. These packages allow us to interact with external database, like PostgreSQL, in order to overcome the memory barrier. Thereafter, we combine the operation with the pbdMPI package to parallelize our function. After the expiration of the above technique we generate and retrieve the desired optimized results. In cases where available RAM is sufficient, we limit our process to pbdMPI package usage in order to decrease computational time and to optimize our results.
Finally, we reconstruct our results in the appropriate format and we store them form further use or we printed on the screen. The overall pipeline for the optimization process can be seen in Fig.
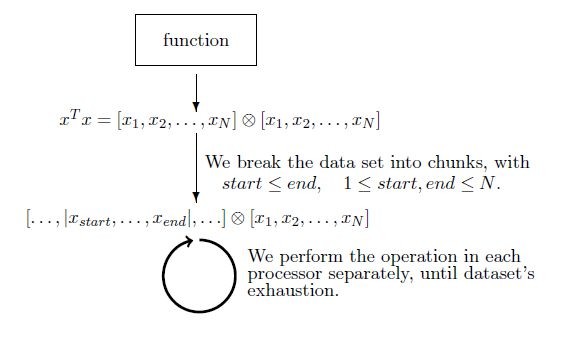
Example 1 Low level optimization (level 1). One characteristic example is the parallelization of functions, such as the outer product (Suppl. material
Example 2 High level optimization (level 2). In the example shown in Fig.
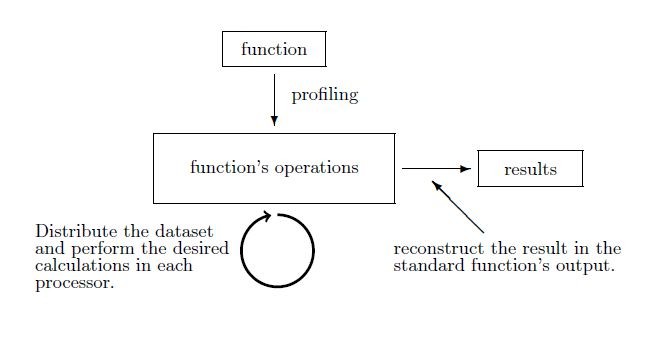
Generic Methodology
Our methodology for optimization aims to combine the solutions on the parallelization level with those on the database storage aspect in a harmonious manner, and not just to integrate them monolithically. More importantly, our methodology needs to be flexible enough to be adapted to the different requirements of each function. For example, it is expected that certain functions perform computationally intensive tasks on small datasets, while others iterate simple operations on big datasets or produce bi-products during their computation that are difficult to maintain in the main memory.
Fig.
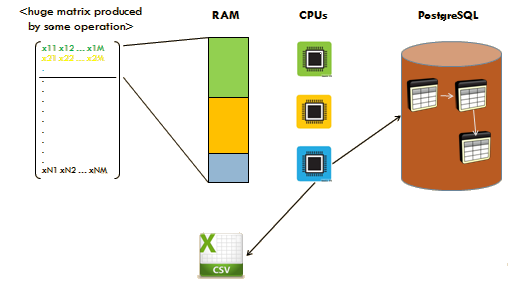
It is important to note that the type of computations performed in each processor is not necessarily restricted to primitive operations, such as matrix multiplication, outer product etc. These operations have of course been redesigned to take advantage of the decomposition of data to the processors available. Still, a big asset of the RvLab offered functionalities is that they provide optimizations at higher levels of abstraction, such as in combining sequences of commonly executed vegan functions into a single one.
For instance, a commonly executed workflow performed by biologists is to provide the output of the taxa2dist function, which is usually a big square matrix, as input to the taxondive function, which generates results of a small size. Both of these functions perform executions of similar operations on the same data multiple times; our enhanced function combines these two functions with a more efficient parallel algorithm that not only achieves significantly quicker execution times, as evidenced in a following section, but also overcomes the memory barriers that exist when the initial datasets are beyond a certain limit. In fact, since the output of taxa2dist does not need to be stored, our function can be used with input data of any size.
Supported optimized RvLab functions
A non-exhaustive list of supported RvLab functions is presented below:
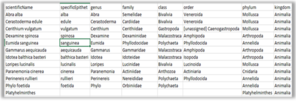
· taxa2dist parallel, taxa2dist (local storage), taxa2dist > taxondive - The taxa2dist function returns a distance matrix from a classification aggregation file which acts as input for taxondive. The combination of these functions computes indices of taxonomic diversity and distinctness, which are averaged taxonomic distances among species or individuals in the community (
· anosim - Analysis of similarities (ANOSIM) provides a way to test statistically whether there is a significant difference between two or more groups of sampling units. It is often used as a hypothesis test after multidimensional scaling analysis.
· adonis - Analysis of variance using distance matrices in order to partition them among sources of variation and fitting linear models (e.g. factors, polynomial regression) to distance matrices. It uses a permutation test with pseudo-F ratios and it is the equivalent of PERMANOVA analysis (
· mantel - Function mantel calculates the Mantel statistic as a matrix correlation between two dissimilarity matrices, and function mantel.partial computes the partial Mantel statistic as the partial matrix correlation between three dissimilarity matrices. The significance of the statistic is evaluated by permuting rows and columns of the first dissimilarity matrix.
· simper - Returns a list of variables (e.g. species) that contribute to the average similarity within and average dissimilarity between groups of samples, using Bray-Curtis index or Euclidean distances.
· bioenv - Returns the best subset of environmental variables, so that the Euclidean distances of scaled environmental variables have the maximum (rank) correlation with community dissimilarities.
The rate statistics are computed using the formula in Suppl. material
Web location (URIs)
Technical specification
Usage rights
MIT license
Implementation
Implements specification
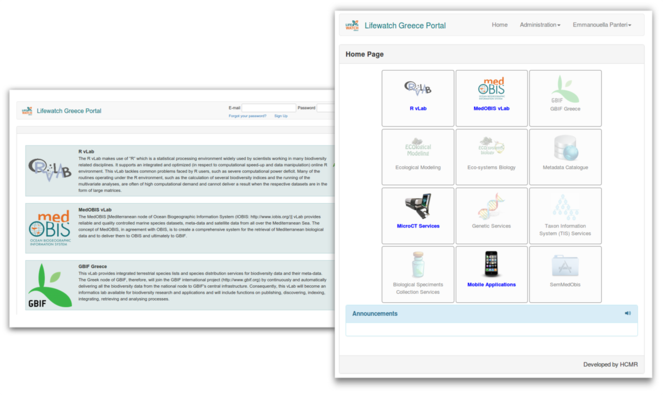
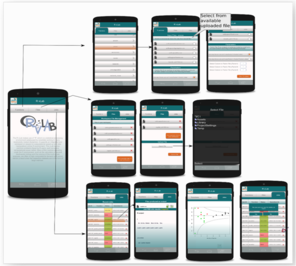
In this section we describe the RvLab web application and how a user can access it through LifeWatchGreece portal. The following screenshots illustrate the web pages a user goes through when using RvLab. After registering and logging in at portal's landing page (Fig.
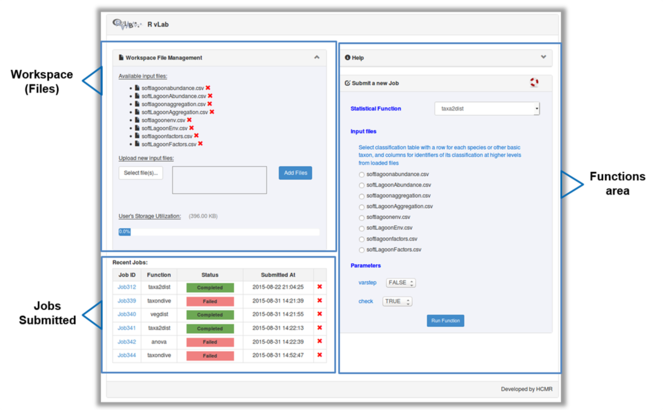
The main interface of RvLab is comprised by four panels (Fig.
Once a job is completed, the user can view the results page by clicking on the Job ID link (Fig.
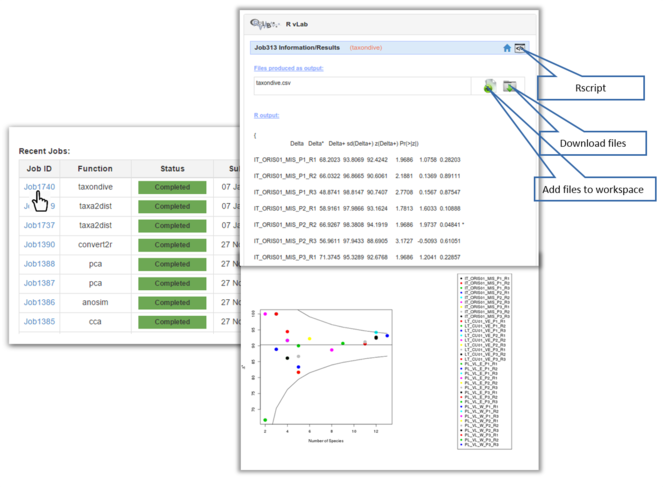
Screen shots showing examples of the graphical results generated by RvLab can be seen in Fig.
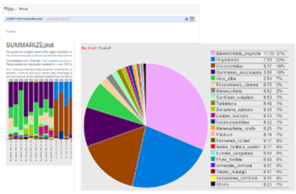
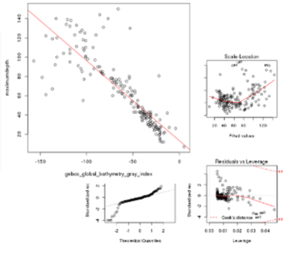
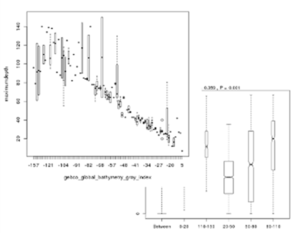
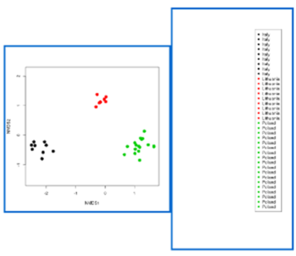
Screen shots showing a few of the graphical results generated by RvLab functions.
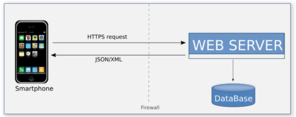
RvLab is developed in Hypertext Preprocessor (PHP) and has been integrated in the LifeWatchGreece portal allowing registration to the common user database used for all virtual laboratories available via the portal. This integration utilizes some background Hypertext Transfer Protocol (HTTP) communication between the portal's core and RvLab's web application that involves exchanging information regarding credentials and access control privileges. Moreover, cron jobs have been deployed to ensure that policies are enforced and job status is updated regularly through Asynchronous JavaScript and XML (AJAX) calls. Although job execution takes place on a cluster, RvLab has direct access to all job folders by mounting (through SSH) the rellevant cluster directories to the web server. RvLab uses Portable Batch System (PBS) scripts to schedule each job for execution on the cluster.
Mobile RvLab application (mobRvLab)
The RvLab mobile application (mobRvLab) has been developed by utilizing Unity3D Platform and C# scripting language. The application is available for android and ios platforms and functions on a dynamical and autonomous basis. It receives data in json format from the LifeWatchGreece portal in real time by exploiting the appropriate web services that have been developed. Whenever data are required, a secure proper communication channel is established between the device and the portal.
As previously mentioned, the RvLab is available after registration and login to the LifeWatchGreece portal. This is a pre-requisite in order the user to access mobRvLab by utilizing the same account credentials. MobRvLab employs the same functionalities adopted by the RvLab. The mobRvLab main page includes general information about the application and also displays three main tabs: “Functions”, “Files” and “Jobs”. The “Functions” tab shows all available functions, same as in the portal version. The user can select which function to run, including parallel implementations of available functions. In the “Jobs” tab the user can view a jobs log file and keep track of each job status. The jobs are presented and ordered by date. Each job can be selected for viewing results or for deletion. The “Files” tab displays the user workspace and allows file management by uploading or deletion of data files. In principle, the mobRvLab provides a direct link, via mobile access, to the RvLab user account created in the LifeWatchGreece portal; jobs are executed in the LifeWatchGreece cluster and not locally, hence allowing user access to the high performance computational resources of the cluster via mobile appplication. The user can choose to submit jobs and view results from either of the virtual laboratories, benefiting by the usability and flexibility of RvLab in data analysis, as well as by the results acquisition. Fig.
RvLab mobile application is available for download at https://portal.lifewatchgreece.eu/mobile_apps
Audience
The desired target audience is the average R user, without requiring expertise and prior training in the field of algorithm optimization and parallelization. However, basic statistical knowledge for using the analytical routines and for the interpretation of results is required.
Additional information
Experimental Evaluation
We conducted a series of experiments to evaluate the generic methodology described in previous sections, in order to study (i) the speedup achieved with the new functions when exploiting the resources of a multiprocessor environment and (ii) to identify optimal allocation of resources given the size of the input data. The reported times are the average of 3 runs for each configuration. They were conducted in a controlled environment, where all external access was blocked; despite being an idealized environment, this setting allowed us to reach consistent conclusions about the behaviour of the functions.
Experimental setup
Our experiments varied between functions requiring large amounts of memory to handle input data, as well as functions performing computationally intensive tasks. For the former category, datasets of increasing size have been used as input. The taxa2dist function, as well as the combined taxa2dist+taxondive, fall into this category, as they rely on the computation of a distance matrix that can become significantly big depending on the initial dataset. For the latter category, we varied the number of computations, namely the number of permutations that need to be executed before producing the result. For each of these cases, we measured the execution time of the parallel version of our functions when allocating a different number of processors and compared these times to the time needed to run the serial function, i.e., the version provided by the vegan package. Note that in certain cases the serial version could not be executed at all, e.g., when the available memory was not enough to handle computations.
All experiments were conducted on a cluster involving 10 Intel Xeon CPU E5-2667 2.9GHz cores with a total of 384Gb RAM. We measured times by allocating 1, 2, 4, 6, 8 or 10 CPUs to the parallel functions, in order to study their behaviour. The results are presented through a series of diagrams which are based on a comparative analysis; absolute timing is mentioned only for verification. Although the current version of the RvLab portal runs over a cluster having a different configuration, the messages conveyed by our experimental analysis are still valid, as we are not interested in the absolute times measured, but rather on the speed up that can be achieved.
Experiment 1. taxa2dist
The diagram in Fig.
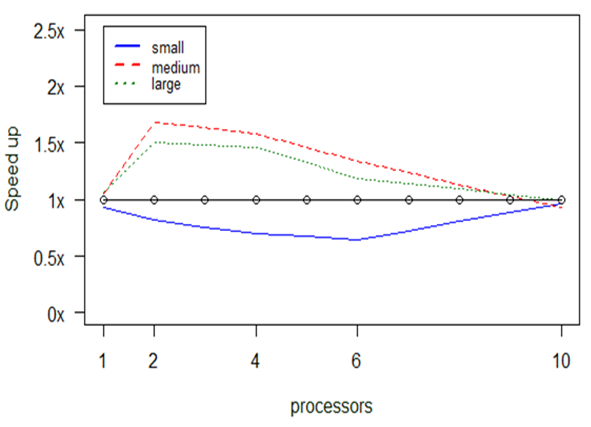
Any values below the 1x boundary denote execution times proportially higher to the serial ones, whereas values above the boundary denote how many times faster the execution was found to be. As mentioned above, we measured our parallel program having different allocations of processors, in order to check at which setting the maximum speedup is achieved. In other words, the diagram shows the behaviour (i.e., speedup) of the parallel program in comparison to the serial one (vertical axis) given two parameters, the number of processors assigned to the program (horizontal axis) and the size of the input data (colored lines).
A first observation that can be made is that for small datasets the serial version is somewhat faster than the parallel one. This is displayed by the points lying below the 1x threshold. Indicatively, while the serial version required 5.1 sec on average to run the small dataset as mentioned before, the parallel version with 2 CPUs needed 6.2 sec and with 4 CPUs 7.3 sec. For such small datasets, the differences in absolute times are very small, therefore any delays introduced due to the initialization of the cluster seem to play an important role.
The situation changes as the input dataset becomes bigger, where the parallel version is faster in many cases. For example, with 4 CPUs the parallel version required 2.14 min for the medium dataset and 14.5 min for the large one, whereas the serial version needed 3.4 min and 21.2 min, respectively.
Nevertheless, speedup decreases as we add more CPUs. This observation verifies a conclusion already known in the ICT community: the parallel solution is not panacea and proper allocation of resources needs to be made not only based on their availability, but also on other parameters, such as the size of the input in our case. It seems that the cost of communicating data between processors becomes considerable as we add more processors.
It should be noted here that none of the aforementioned functions was able to operate with datasets of larger size, due to memory overflow. For such datasets, one needs to revert to the PostgreSQL variation that stores data on secondary memory, which inevitably takes much longer times to execute.
Experiment 2. taxa2dist+taxondive
Since the output of taxa2dist is very often used as input to the taxondive function, we implemented the parallel version that combines the two, as described in a previous section. The taxondive computes indices of taxonomic diversity and distinctness, which are averaged taxonomic distances among species or individuals in the community (
Fig.
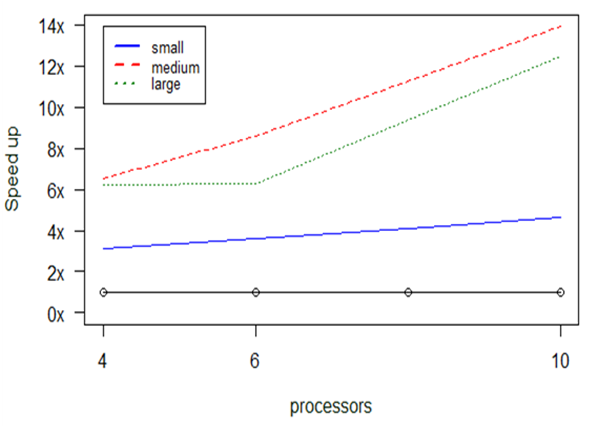
What is even more impressive is that we even managed to run datasets of much larger sizes that cannot be executed otherwise: indicatively, we managed to complete the calculation of the taxa2dist+taxondive function for an input dataset having 168,931 lines of species in 6.6 hours when allocating 10CPUs.
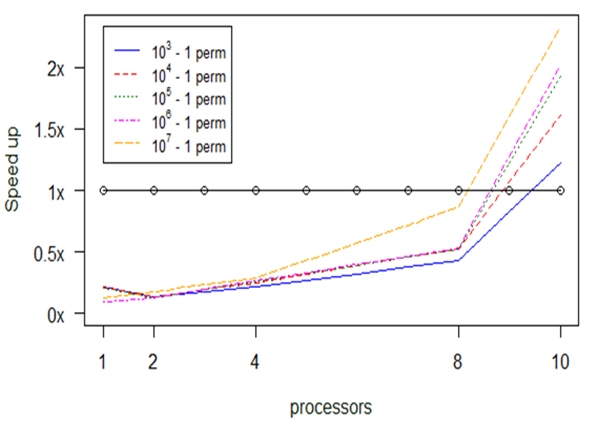
Experiment 3. anosim
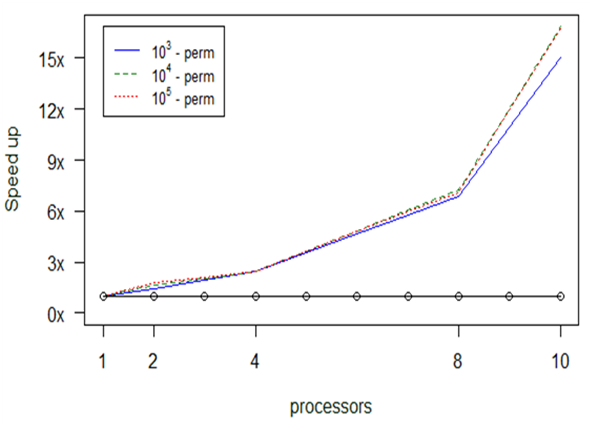
The next set of experiments concentrated on the anosim function. The preliminary profiling tests we performed showed that the main issues one needs to tackle are concentrated on the consumption of time and not on memory overflow. This time consumption is strongly correlated with the number of “permutations” we introduce to the function.
As we see in Fig.
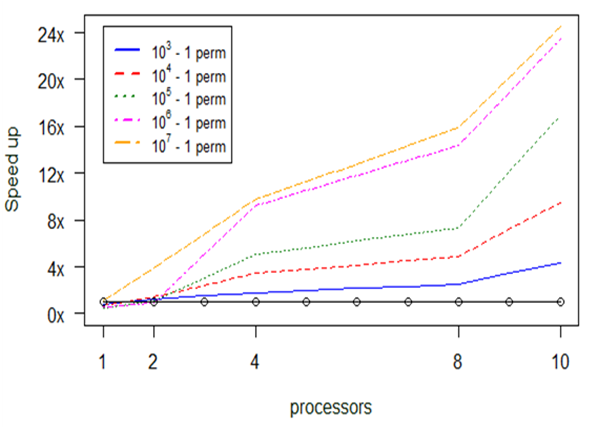
The above diagram (Fig.
In Fig.
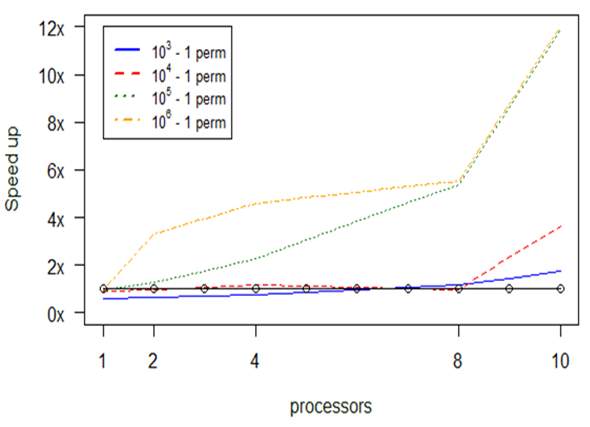
Experiment 4. adonis
Our profiling tests with the adonis function revealed that no memory issues are likely to be met in this case; instead, the main bottleneck that should concern us is the scaling of computation effort. The dominant factor of time consumption is the number of permutations set as input to the function, therefore we broke the task of computing them into chunks to be assigned to each of the available processors.
Fig.
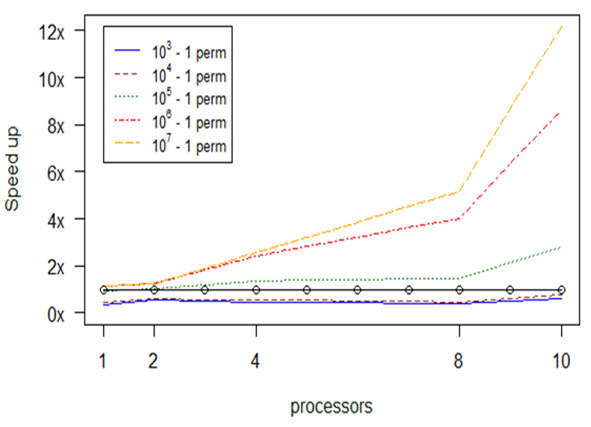
Experiment 5. simper
Similarly to the anosim and adonis functions, the simper function also relies on the number of computations requested and not on the available memory. As before, we break the permutations into chunks which are assigned to the available processors.
Fig.
As we already observed in the experiments with the previous functions, we notice again here that when the number of permutations is small parallelization is not always beneficial: in fact, increasing the number of processors may hinder performance, due to the communication costs involved.
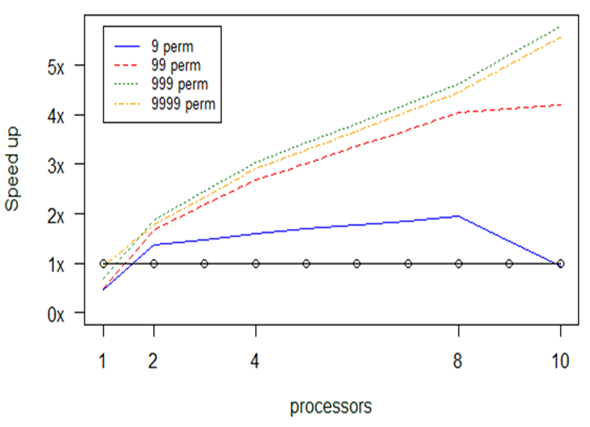
Experiment 6. mantel
Similarly to the previous functions, the mantel function relies on recurrent computations without producing any memory leakage or overflow. These recurrent computations depend on the number of permutation.
For further investigation we performed two classes of experiments, one for a small input dataset, 9 Mb, and one for a large input dataset, 230 Mb. The diagrams in Figs
In Fig.
In Fig.
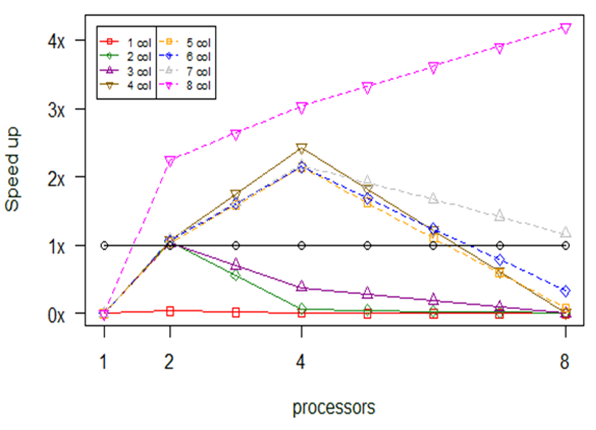
Experiment 7. bioenv
Bioenv also depends on repeated computations. The main difference with the previous approach is that instead of breaking the permutation’s linked computations into chunks, we break the ncol’s linked computations. This modification came along with a limitation. The limitation suggests that it is not useful to use more processors than the number of ncol.
In Fig.
Outlook and Future Work
Future implementations of the RvLab will include additional functions that are important for environmental ecology, biodiversity, fisheries and modelling. The RvLab has the possibility to incorporate a variety of functions and R packages, apart from the ones already implemented, should the user contact the development team with a relevant request. Moreover, we are currently also investigating issues of assigning jobs as a function of available resources in order to ensure optimal core distribution and function execution for all jobs submitted to RvLab.
Conclusions
The RvLab is a very useful and powerful tool, both for users who are already familiar with R (and some of its functions) but also for students and/or scientists who are in favour of open source software and would like to dedicate some time to get familiar with its functions, without having to go through the steep command line R learning curve.
When compared with online virtual environments, such as the "Multivariate AnalysiS Applications for Microbial Ecology (MASAME)" suite, apart from the intrinsic similarities between the two platforms, it is obvious that the RvLab can implement a plethora of functions, some of which are parallelized. Thus, the user can benefit from the availability of newly designed functions if the dataset to be analysed requires their implementation.
The accessibility of RvLab is also one of its major advantages; apart from being part of the LifeWatchGreece Infrastructure, it is also a part of the LifeWatch Marine Virtual Research Environment (VRE). The LifeWatch Marine Virtual Research Environment (VRE) portal is bringing together several marine resources, databases, data systems, web services, tools, etc. into one marine virtual research environment, allowing researchers to retrieve and access a great variety of data resources and tools.
In addition, the RvLab is an interactive virtual laboratory; should the user require other types of functions, these can be added in the "laboratory" and become available online in a short time. Therefore, the more users are logging in the portal and using it for their analyses, the more they can improve the RvLab, given the enormous possibilities of its programming language.
Appendix
The source code for the functions is available for download at the RvLab.
Acknowledgements
The authors would like to thank the LifeWatchGreece core team for constructive and informative discussions and for their valuable input to issues regarding RvLab. This work was supported by the LifeWatchGreece infrastructure (MIS 384676), funded by the Greek Government under the General Secretariat of Research and Technology (GSRT), ESFRI Projects, National Strategic Reference Framework (NSRF).
Author contributions
CV and TP contributed to the analysis, parallelization and evaluation of the functions. AO and AG contributed to the overall design and implementations of the graphical interface. UZI, NP, AFG and SF provided code for functions implemented at the RvLab. IF designed the mobile application. CB, MD and CA had the initial idea for the creation of the RvLab. CV, TP, AO, CP, EC, EP, EVB, SF and CA contributed to the write-up and proofreading of the manuscript.
References
- A new method for non-parametric multivariate analysis of variance.Austral Ecology26(1):32‑46. https://doi.org/10.1111/j.1442-9993.2001.01070.pp.x
- A guide to statistical analysis in microbial ecology: a community-focused, living review of multivariate data analyses.FEMS Microbiology Ecology90(3):543‑550. https://doi.org/10.1111/1574-6941.12437
- Global Biodiversity Informatics: setting the scene for a “new world” of ecological forecasting.Biodiversity Informatics1:1. https://doi.org/10.17161/bi.v1i0.3
- pbdMPI: Programming with Big Data -- Interface to MPI. R Package. http://cran.r-project.org/package=pbdMPI
- A taxonomic distinctness index and its statistical properties.Journal of Applied Ecology35(4):523‑531. https://doi.org/10.1046/j.1365-2664.1998.3540523.x
- The taxonomic distinctness measure of biodiversity:weighting of step lengths between hierarchical levels.Marine Ecology Progress Series184:21‑29. https://doi.org/10.3354/meps184021
- RPostgreSQL: R interface to the PostgreSQL database system.N/AN/A:N/A. URL: http://CRAN.R-project.org/package=RPostgreSQL
- Scalable Strategies for Computing with Massive Data.Journal of Statistical Software55(14):1‑19. https://doi.org/10.18637/jss.v055.i14
- vegan: Community Ecology Package, R package version 2.3-0.N/A,N/App. URL: http://CRAN.R-project.org/package=vegan
- Programming with Big Data in R.onlinepp. URL: http://r-pbd.org/
- Metagenomics: Tools and Insights for Analyzing Next-Generation Sequencing Data Derived from Biodiversity Studies.Bioinformatics and Biology Insights9:75‑88. https://doi.org/10.4137/bbi.s12462
- Computational ecology as an emerging science.Interface Focus2(2):241‑254. https://doi.org/10.1098/rsfs.2011.0083
- R: A language and environment for statistical computing.R Foundation for Statistical Computing,Vienna, Austria,N/App. URL: http://www.R-project.org/
- pbdDMAT: Distributed Matrix Algebra Computation. R Package, URL http://cran.r-project.org/package=pbdDMAT.N/AN/A:N/A. URL: http://cran.r-project.org/package=pbdDMAT
- Biodiversity informatics: managing and applying primary biodiversity data.Philosophical Transactions of the Royal Society B: Biological Sciences359(1444):689‑698. https://doi.org/10.1098/rstb.2003.1439
- proftools: Profile Output Processing Tools for R.N/AN/A:N/A. URL: http://CRAN.R-project.org/package=proftools
- snow: Simple Network of Workstations.N/AN/A:N/A. URL: http://CRAN.R-project.org/package=snow
- multicore: Parallel processing of R code on machines with multiple cores or CPUs.onlinepp. URL: https://cran.r-project.org/package=multicore
- profr: An alternative display for profiling information.N/AN/A:N/A. URL: http://CRAN.R-project.org/package=profr
- dplyr: A Grammar of Data Manipulation.N/AN/A:N/A. URL: http://CRAN.R-project.org/package=dplyr
- Rmpi: Parallel Statistical Computing in R.R News2(2):10‑14. URL: http://cran.r-project.org/doc/Rnews/Rnews_2002-2.pdf