|
Biodiversity Data Journal :
Data Paper (Biosciences)
|
|
Corresponding author: Krisztina Lohonya (k.lohonya@nhm.ac.uk), Laurence Livermore (l.livermore@nhm.ac.uk)
Academic editor: Arjun Prasad Tiwari
Received: 15 Sep 2022 | Accepted: 08 Nov 2022 | Published: 14 Nov 2022
© 2022 Krisztina Lohonya, Laurence Livermore, Jacek Wajer, Robyn Crowther, Elizabeth Devenish
This is an open access article distributed under the terms of the Creative Commons Attribution License (CC BY 4.0), which permits unrestricted use, distribution, and reproduction in any medium, provided the original author and source are credited.
Citation:
Lohonya K, Livermore L, Wajer J, Crowther R, Devenish E (2022) Digitisation of the Natural History Museum’s collection of Dalbergia, Pterocarpus and the subtribe Phaseolinae (Fabaceae, Faboideae). Biodiversity Data Journal 10: e94939. https://doi.org/10.3897/BDJ.10.e94939
|
|
Abstract
Background
In 2018, the Natural History Museum (NHMUK, herbarium code: BM) undertook a pilot digitisation project together with the Royal Botanic Gardens Kew (project Lead) and the Royal Botanic Garden Edinburgh to collectively digitise non-type herbarium material of the subtribe Phaseolinae and the genera Dalbergia L.f. and Pterocarpus Jacq. (rosewoods and padauk), all from the economically important family of legumes (Leguminosae or Fabaceae).
These taxonomic groups were chosen to provide specimen data for two potential use cases: 1) to support the development of dry beans as a sustainable and resilient crop; 2) to aid conservation and sustainable use of rosewoods and padauk. Collectively, these use case studies support the aims of the UK’s Department for Environment Food & Rural Affairs (DEFRA)-allocated, Official Development Assistance (ODA) funding.
New information
We present the images and metadata for 11,222 NHMUK specimens. The metadata includes label transcription and georeferencing, along with summary data on geographic, taxonomic, collector and temporal coverage. We also provide timings and the methodology for our transcription and georeferencing protocols. Approximately 35% of specimens digitised were collected in ODA-listed countries, in tropical Africa, but also in South East Asia and South America.
Keywords
digitisation, Phaseolinae, Dalbergia, Pterocarpus, legumes, georeferencing, transcription, crop wild relatives, specimens, rosewoods, cultivated beans, sustainable timber, herbarium, herbaria, natural history collections
Introduction
The role of natural history collections in conservation science research continues to grow. When correctly identified and interpreted, digitised herbarium specimens can provide important information about the distribution of the individual species and also highlight which species occur naturally together (
While there have been collaborative efforts between herbaria in the past, these have tended to prioritise digitisation of type specimens (
These taxonomic groups were chosen for two case studies using herbarium collections to support the aims of the UK’s Department for Environment Food & Rural Affairs (DEFRA)-allocated, Official Development Assistance (ODA) funding.
The first case study focused on the subtribe Phaseolinae, which includes important food crop plants (
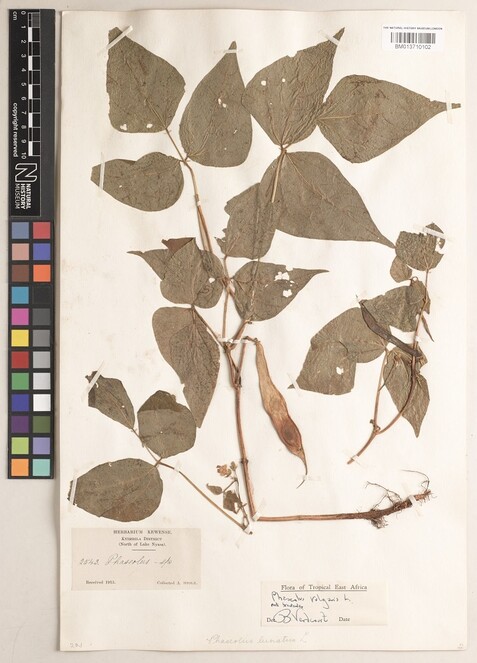
Phaseolus vulgaris L. (BM013710102).
The second case study focused on the conservation and sustainable use of rosewoods (Dalbergia L.f.) (Fig.
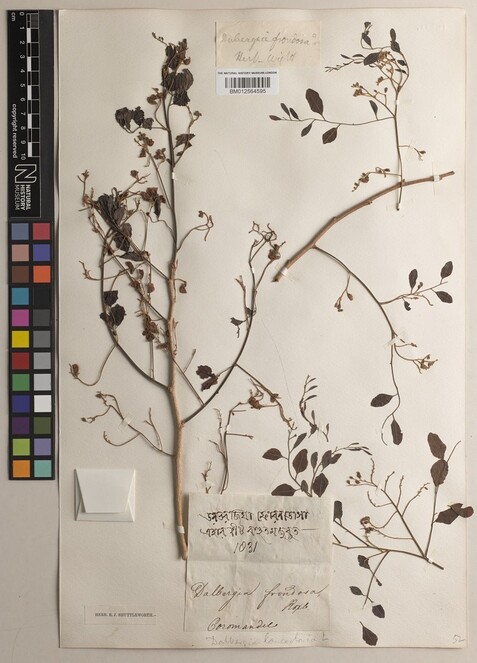
Dalbergia lanceolaria L.f. (BM012564594).
In addition to providing the specimen images and data, this paper describes the digitisation methodology, including the digitisation rates, photography, label data transcription and georeferencing protocols for the NHMUK specimens for both case study groups described above. We also summarise the geographic, taxonomic, temporal coverage and significant collectors of the NHMUK collections of Dalbergia, Pterocarpus and the Phaseolinae.
General description
This article describes and analyses a digitised herbarium dataset published on the Natural History Museum's Data Portal (
Project description
Defra ODA Legumes Project
Krisztina Lohonya, Robyn Crowther, Elizabeth Devenish, Louise Allan, Laurence Livermore, Jacek Wajer, Hillery Warner
The collection was digitised with a mandate to create and publicly share a dataset of 10,000 herbarium specimens (images and metadata) to be used in scientific research into food security and timber production in ODA-listed countries. At the planning stage, we expected that around 75% of our digitised specimens would be from the ODA-listed countries (see the full list in the Appendix - ODA Countries), with 30% from the least developed to low and middle income countries, particularly in tropical Africa, but also in South East Asia and South America.
This pilot project was made possible through the Department for Environment Food & Rural Affairs (DEFRA)-allocated, Official Development Assistance (ODA) funding. This aid money is distributed by the UK government in its “global efforts to defeat poverty, tackle instability and create prosperity in developing countries”. The Museum’s Digital Collections Programme supported the subsequent georeferencing work and writing of this paper.
Sampling methods
Collectors and collector coverage
We were able to interpret and transcribe the collectors’ names from the majority of our specimen labels (10,879 out of 11,222). In 343 cases, the collector was either not identified on the label or we were unable to infer their identity either from their handwriting or using other information associated with their specimens. We recorded such collectors as ‘Anon.’ in our CMS (see Table
| Collector | Collection number | Collection date | Locality |
| Anon. | s.n. | sin. dat. | sin. loc. |
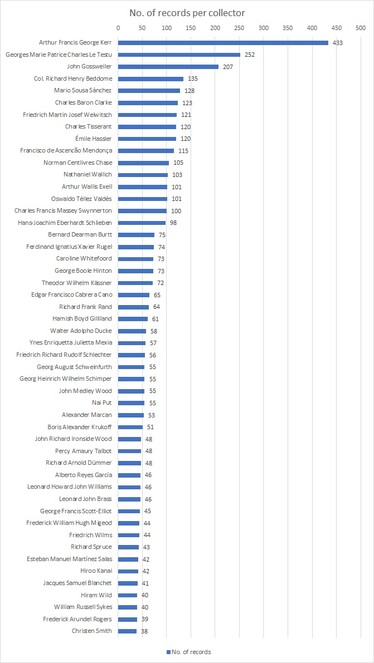
List of top 50 collectors by the number of records in the ODA-digitised section of the herbarium (full list available in the Suppl. material
| Wikidata Q Code | Collector Name | No. of records | |
| 1 | Q4798733 | Arthur Francis George Kerr | 433 |
| 2 | Q55684213 | Georges Marie Patrice Charles Le Testu | 252 |
| 3 | Q15727183 | John Gossweiler | 207 |
| 4 | Q2985757 | Richard Henry Beddome | 135 |
| 5 | Q56167901 | Mario Sousa Sánchez | 128 |
| 6 | Q2659116 | Charles Baron Clarke | 123 |
| 7 | Q78609 | Friedrich Martin Josef Welwitsch | 121 |
| 8 | Q21340735 | Charles Tisserant | 120 |
| 9 | Q116720 | Émile Hassler | 120 |
| 10 | Q4290420 | Francisco de Ascencão Mendonça | 115 |
| 11 | Q108197157 | Norman Centlivres Chase | 105 |
| 12 | Q730310 | Nathaniel Wallich | 103 |
| 13 | Q2865378 | Arthur Wallis Exell | 101 |
| 14 | Q5651733 | Oswaldo Téllez Valdés | 101 |
| 15 | Q5077783 | Charles Francis Massey Swynnerton | 100 |
| 16 | Q21337647 | Hans-Joachim Eberhardt Schlieben | 98 |
| 17 | Q2897760 | Bernard Dearman Burtt | 75 |
| 18 | Q21607532 | Ferdinand Igatius Xavier Rugel | 74 |
| 19 | Q21395774 | Caroline Whitefoord | 73 |
| 20 | Q55532773 | George Boole Hinton | 73 |
| 21 | Q108197234 | Theodor Wilhelm Kässner | 72 |
| 22 | Q108197361 | Edgar Francisco Cabrera Cano | 65 |
| 23 | Q55455995 | Richard Frank Rand | 64 |
| 24 | Q21340660 | Hamish Boyd Gilliland | 61 |
| 25 | Q2601698 | Walter Adolpho Ducke | 58 |
| 26 | Q2600470 | Ynes Enriquetta Julietta Mexia | 57 |
| 27 | Q62278 | Friedrich Richard Rudolf Schlechter | 56 |
| 28 | Q63126 | Georg August Schweinfurth | 55 |
| 29 | Q72899 | Georg Heinrich Wilhelm Schimper | 55 |
| 30 | Q1701052 | John Medley Wood | 55 |
| 31 | Q108197317 | Nai Put | 55 |
| 32 | Q108197276 | Alexander Marcan | 53 |
| 33 | Q5732192 | Boris Alexander Krukoff | 51 |
| 34 | Q5933549 | John Richard Ironside Wood | 48 |
| 35 | Q2043550 | Percy Amaury Talbot | 48 |
| 36 | Q3430474 | Richard Arnold Dümmer | 48 |
| 37 | Q21607143 | Alberto Reyes García | 46 |
| 38 | Q21612729 | Leonard Howard John Williams | 46 |
| 39 | Q6525437 | Leonard John Brass | 46 |
| 40 | Q5877823 | George Francis Scott-Elliot | 45 |
| 41 | Q108197333 | Frederick William Hugh Migeod | 44 |
| 42 | Q5503949 | Friedrich Wilms | 44 |
| 43 | Q1349394 | Richard Spruce | 43 |
| 44 | Q13501872 | Esteban Manuel Martínez Salas | 42 |
| 45 | Q21517258 | Hiroo Kanai | 42 |
| 46 | Q3159964 | Jacques Samuel Blanchet | 41 |
| 47 | Q5792958 | Hiram Wild | 40 |
| 48 | Q6167727 | William Russell Sykes | 40 |
| 49 | Q21607328 | Frederick Arundel Rogers | 39 |
| 50 | Q1078398 | Christen Smith | 38 |
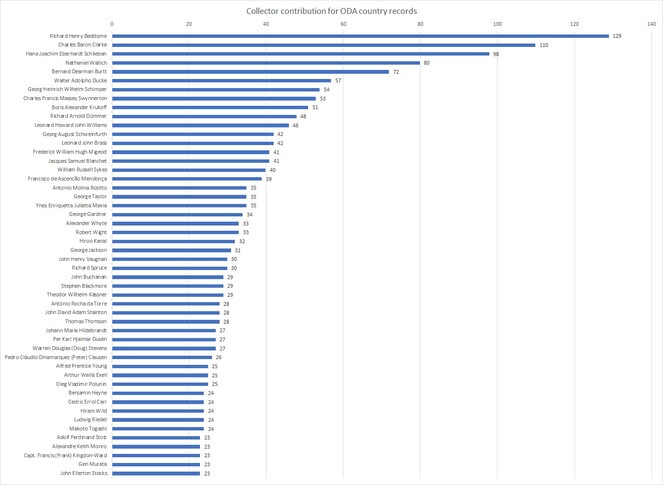
Only 770 out of the 2,226 individuals identified during this project collected their specimens in the ODA-listed countries. The highest contributors were: Richard Beddome (130 specimens), Charles Clarke (110), Hans Schlieben (98) and Nathaniel Wallich (79). Below, you can see the percentage distribution of the 50 most active collector’s contributions. Beddome, Clarke and Wallich collected mostly in India and the surrounding countries. Schlieben’s collections are mainly from Tanzania and Madagascar (see Fig.
Methodology - Databasing the collection
The digitisation process was broken into several smaller steps to ensure a smooth workflow. First, the curator responsible for the Leguminosae family cleaned the existing database of the plant names in our collections management system (EMu) and ensured that all herbarium folders*
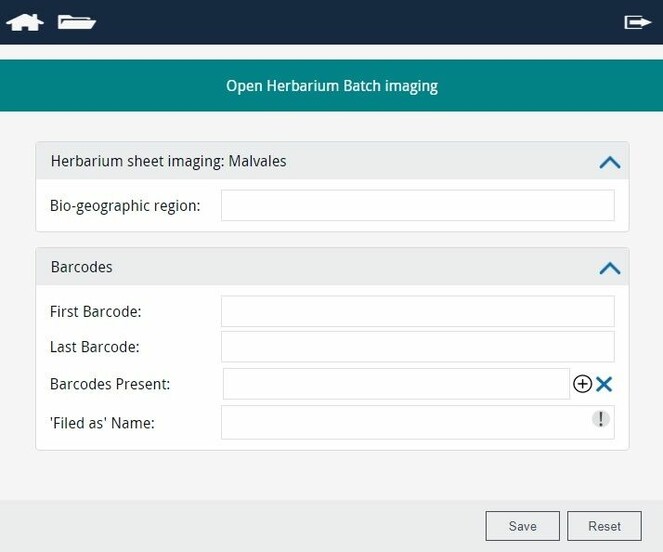
In the next phase, we transcribed the label information associated with each specimen from the images generated during the stub-recording stage. We adopted an existing transcription protocol used by the curation team at the BM Herbarium to standardise the resulting data, with set marking for missing information (see Table
During georeferencing, we followed the NHMUK’s georeferencing protocols and geographical standards (
During the funded part of the project (November 2018 – March 2019), we stub-recorded and imaged 11,222 specimens of Dalbergia, Pterocarpus and 51 genera in the subtribe Phaseolinae and their relatives, but in that period, we only managed to transcribe the label information and georeference the records of Dalbergia and Pterocarpus. After the initial project completion, during 2020–2021, we completed the transcription and country-level georeferencing for all remaining records. Just like in the pilot project, we georeferenced in two stages: first, we worked out the current name of the country of collection for each specimen, as many of them came from the territories that have changed their names or their boundaries have shifted, then we completed georeferencing with coordinates for each location. In the initial phase of the pilot, when we fully transcribed and georeferenced all records of Dalbergia and Pterocarpus, we achieved a rate of approximately 86 transcribed and georeferenced records per day per person (Table
|
Date |
Average number of inventory records per day | Average number of specimens imaged per day | Average number of records transcribed and georeferenced per day | |
|
November |
2018 |
297 |
n/a |
n/a |
|
December |
2018 |
434.5 |
610.5 |
n/a |
|
January |
2019 |
412.5 |
429 |
82.5 |
|
February |
2019 |
385 |
280.5 |
104.5 |
|
March |
2019 |
374 |
209 |
71.5 |
We were able to assign the country-level data to 10,857 out of the total number of 11,222 records. The collecting locality for the remaining records was either lost (unknown for at least 32 specimens) or exact georeferencing was not possible due to the ambiguity of the provenance data. This problem is particularly prevalent in older herbarium sheets which usually have rather vague locality information associated with them. For example, the specimens collected by Christen Smith during Captain Tuckey’s expedition to Congo in 1816 have no precise locality associated with them other than ‘Congo’. Without any additional data from Smith's diary or from Tuckey’s charts of the River Congo, it is not possible to determine if these specimens were collected in the modern-day Angola, the Democratic Republic of the Congo or the Republic of the Congo, all three countries bordering the course of the expedition undertaken by these two explorers. In other instances, exact georeferencing was not possible because the territory listed on the label does not exist anymore or it currently covers an area of many different countries. For example, the locality “New Grenada” without any additional information is not precise enough to be assigned to just one specific country, as this historical Viceroyalty of the Spanish Empire in the northern part of South America covered what is now parts of Brazil, Colombia, Guyana, Ecuador, Panama, Peru, Suriname, Trinidad and Tobago and Venezuela.
Digitisation rates
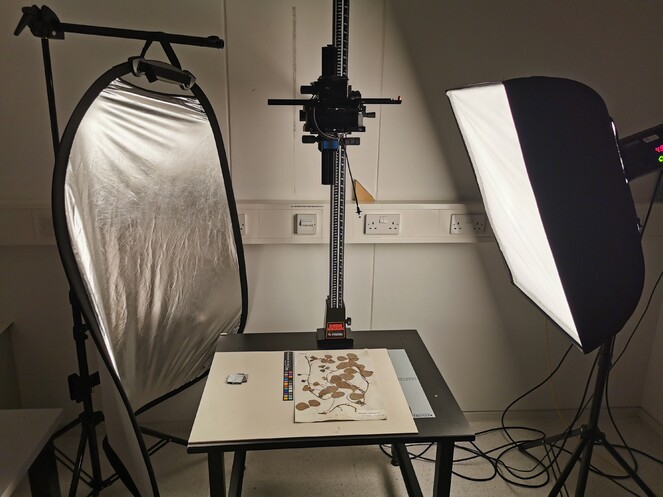
The collection was digitised by three digitisers: one full-time and two part-time. The initial steps included curatorial checks, barcoding and inventory record creation. The imaging part of the digitisation consisted of image capture, file transfer, upload and record linkage in our collection management system (CMS). During the stub-recording phase, we generated, on average, 400 records per day per person. During the imaging part of the project, we photographed ca. 380 specimens per day per person. Our imaging rates were lower than stub-recording because many of our specimens required taking more than one image due to having their provenance notes written at the back of the sheets or having their collection labels and identification labels covering each other (Table
With our initial approach for comprehensive data transcription, used only for the Dalbergia and Pterocarpus dataset (November 2018 to March 2019), we were able to interpret and fully georeference, on average, 86 records per day per person. In the second phase of the project (November 2020 to April 2021), during which we transcribed the collection data for all the remaining specimens of the Phaseolineae subtribe and their relatives, but with georeferencing of the collecting sites scaled down to a country level only, we were able to complete, on average, 115 records per day (Table
Digitisation (Transcription) rates, 2020–2021.
*We had minor problems with our CMS system at that time.
|
Date |
Number of specimens |
Number of working days |
Average number of specimens transcribed per day |
|
November 2020* |
1941 |
21.6 |
89.9 |
|
December 2020 |
1317 |
11.65 |
113 |
|
January 2021 |
1714 |
13.75 |
124.7 |
|
February 2021 |
1396 |
12.3 |
113.5 |
|
March 2021 |
2002 |
16.85 |
118.8 |
|
April 2021 |
638 |
5 |
127.6 |
Geographic coverage
Most of the specimens digitised as part of this pilot have been georeferenced at least to a country level. We were unable to assign modern country names to 365 out of the total 11,222 records, all of which had either incomplete or ambiguous geographical information associated with them.
We established that the remaining 10,857 specimens were collected from at least 142 countries around the world (Fig.
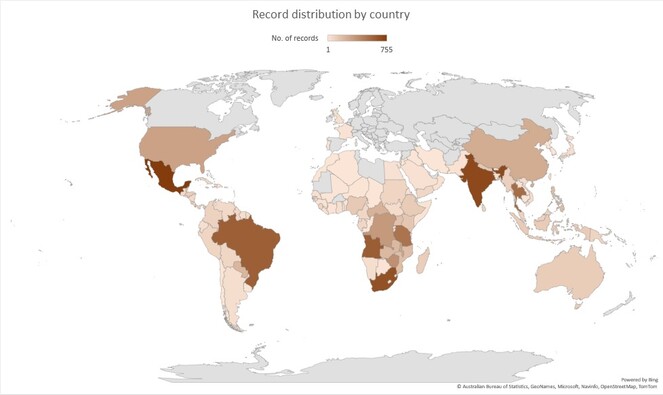
The countries with the most records are Mexico (755), India (699), South Africa (658), Angola (607) and Brazil (599) (see the full list: Suppl. material
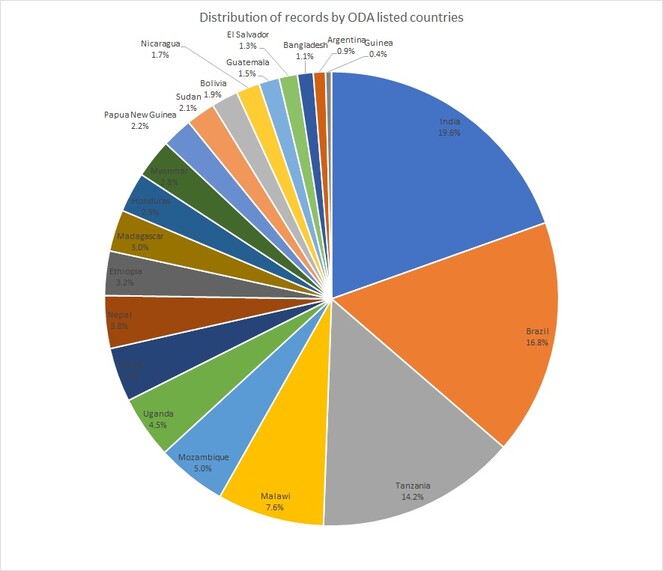
The coverage of the ODA listed countries was of a particular interest to us. When only placing the ODA countries in the chart (Fig.
Taxonomic coverage
Taxonomic Scope
-
Dalbergia L.f. (global tropical trees, shrubs & lianas, includes rosewoods [Fabaceae:Faboideae])
-
Pterocarpus Jacq. (pantropical tree genus aka Padauk, [Fabaceae:Faboideae])
-
Phaseolinae [Fabaceae: Faboideae] genera:
-
Alistilus
-
Condylostylis
-
Decorsea
-
Dipogon
-
Dolichopsis
-
Dolichos
-
Dysolobium
-
Kerstingiella
-
Lablab
-
Macroptilium
-
Macrotyloma
-
Minkelersia
-
Neorautanenia
-
Nesphostylis
-
Otoptera
-
Oxyrhynchus
-
Phaseolus
-
Physostigma
-
Psophocarpus
-
Ramirezella
-
Spathionema
-
Sphenostylis
-
Strophostyles
-
Vatovaea
-
Vigna
-
-
Other Fabaceae genera (Tribe or Subtribe):
-
Cyclolobium (Brongniartieae)
-
Adenodolichos (Cajaninae)
-
Atylosia (Cajaninae)
-
Bolusafra (Cajaninae)
-
Cajanus (Cajaninae)
-
Carrissoa (Cajaninae)
-
Dunbaria (Cajaninae)
-
Eriosema (Cajaninae)
-
Flemingia (Cajaninae)
-
Paracalyx (Cajaninae)
-
Rhynchosia (Cajaninae)
-
Centrolobium (Dalbergieae)
-
Machaerium (Dalbergieae)
-
Paramachaerium (Dalbergieae)
-
Platypodium (Dalbergieae)
-
Steinbachiella (Dalbergieae)
-
Tipuana (Dalbergieae)
-
Vatairea (Dalbergieae)
-
Vataireopsis (Dalbergieae)
-
Eminia (Glycininae)
-
Glycine (Glycininae)
-
Pachyrhizus (Glycininae)
-
Pseudeminia (Glycininae)
-
Pseudovigna (Glycininae)
-
Phylloxylon (Indigofereae)
-
Dalbergiella (Millettieae)
-
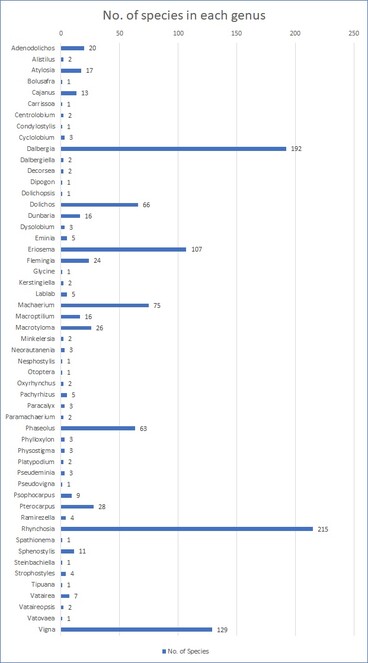
Our set includes the data transcribed from the labels of 11,208 herbarium specimens of the legume genera Dalbergia L.f. and Pterocarpus Jacq. and from the 51 genera of the subtribe Phaseolinae and their relatives in the tribes Brongniartieae, Dalbergieae, Indigofereae, Millettieae and Phaseoleae. In total, we have digitised 192 species of Dalbergia and 28 species of Pterocarpus currently found in our collection. In the remaining group, the three genera of which we have the most species in our collection are: Rhynchosia (215), Vigna (129) and Eriosema (107) (Fig.
Temporal coverage
From the 11,222 records in our dataset, we could identify temporal qualifiers for 9271 records. From these records, the peak decade of collection was the 1930s (1,493 records or 16.1%), with almost half (4,583 specimens or 49.43%) collected between 1900 and 1950 (Fig.
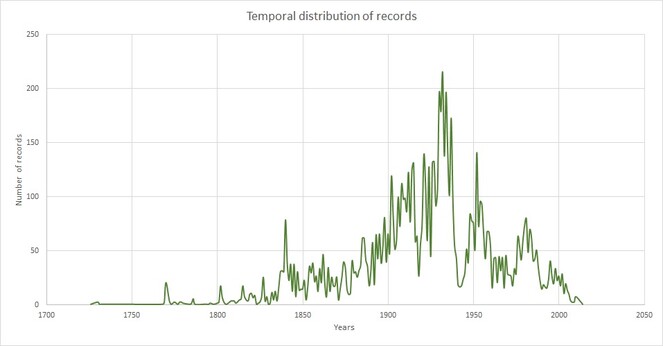
There are also two smaller collecting peaks around the 1840s and 1980s. The first peak can be attributed to Ferdinand Rugel, who collected in the Americas and Carl Zeyher, who collected in South Africa. The second peak can be attributed to Caroline Whitefoord, Edgar Cabrera Cano, Mario Sousa Sánchez and colleagues collecting extensively in Central America.
Collection data
Usage licence
Data resources
The dataset consists of 11,222 records of digitised herbarium specimens. For each specimen, the species name, locality, collection date, collector and collection number are recorded.
| Column label | Column description |
|---|---|
| dwc:basisOfRecord | The specific nature of the data record. |
| dwc:occurrenceID | An identifier for the Occurrence (as opposed to a particular digital record of the occurrence). In the absence of a persistent global unique identifier, construct one from a combination of identifiers in the record that will most closely make the occurrenceID globally unique. |
| _id | Equivalent of a primary key. |
| dwc:recordNumber | An identifier given to the Occurrence at the time it was recorded. Often serves as a link between field notes and an Occurrence record, such as a specimen collector's number. |
| dwc:institutionCode | The name (or acronym) in use by the institution having custody of the object(s) or information referred to in the record. |
| dwc:collectionCode | The name, acronym, coden or initialism identifying the collection or dataset from which the record was derived. |
| dwc:catalogNumber | An identifier (preferably unique) for the record within the dataset or collection. |
| dwc:otherCatalogNumbers | A list (concatenated and separated) of previous or alternative fully qualified catalogue numbers or other human-used identifiers for the same Occurrence, whether in the current or any other dataset or collection. |
| dwc:recordedBy | A list (concatenated and separated) of names of people, groups or organisations responsible for recording the original Occurrence. The primary collector or observer, especially one who applies a personal identifier (recordNumber), should be listed first. |
| dwc:family | The full scientific name of the family in which the taxon is classified. |
| dwc:higherClassification | A list (concatenated and separated) of taxa names terminating at the rank immediately superior to the taxon referenced in the taxon record. |
| dwc:order | The full scientific name of the order in which the taxon is classified. |
| dwc:genus | The full scientific name of the genus in which the taxon is classified. |
| dwc:verbatimLocality | The original textual description of the place. |
| dwc:specificEpithet | The name of the first or species epithet of the scientificName. |
| dwc:scientificNameAuthorship | The authorship information for the scientificName formatted according to the conventions of the applicable nomenclaturalCode. |
| dwc:higherGeography | A list (concatenated and separated) of geographic names less specific than the information captured in the locality term. |
| dwc:continent | The name of the continent in which the Location occurs. |
| dwc:country | The name of the country or major administrative unit in which the Location occurs. |
| dwc:eventDate | The date-time or interval during which an Event occurred. For occurrences, this is the date-time when the event was recorded. Not suitable for a time in a geological context. |
| dwc:locality | The specific description of the place. |
| dwc:stateProvince | The name of the next smaller administrative region than country (state, province, canton, department, region etc.) in which the Location occurs. |
| dwc:decimalLatitude | The geographic latitude (in decimal degrees, using the spatial reference system given in geodeticDatum) of the geographic centre of a Location. Positive values are north of the Equator, negative values are south of it. Legal values lie between -90 and 90, inclusive. |
| dwc:decimalLongitude | he geographic longitude (in decimal degrees, using the spatial reference system given in geodeticDatum) of the geographic centre of a Location. Positive values are east of the Greenwich Meridian, negative values are west of it. Legal values lie between -180 and 180, inclusive. |
| dwc:georeferenceProtocol | A description or reference to the methods used to determine the spatial footprint, coordinates and uncertainties. |
| dwc:county | The full, unabbreviated name of the next smaller administrative region than stateProvince (county, shire, department, etc.) in which the Location occurs. |
| dwc:minimumElevationInMetres | The lower limit of the range of elevation (altitude, usually above sea level), in metres. |
| dwc:georeferenceSources | A list (concatenated and separated) of maps, gazetteers or other resources used to georeference the Location, described specifically enough to allow anyone in the future to use the same resources. |
| dwc:infraspecificEpithet | The name of the lowest or terminal infraspecific epithet of the scientificName, excluding any rank designation. |
| dwc:island | Recommended best practice is to use a controlled vocabulary such as the Getty Thesaurus of Geographic Names. |
| dwc:islandGroup | The name of the island group in which the Location occurs. |
| dwc:scientificName | The full scientific name, with authorship and date information, if known. When forming part of an Identification, this should be the name in the lowest level taxonomic rank that can be determined. This term should not contain identification qualifications, which should instead be supplied in the IdentificationQualifier term. |
| dwc:taxonRank | The taxonomic rank of the most specific name in the scientificName. |
| dwc:maximumElevationInMetres | The upper limit of the range of elevation (altitude, usually above sea level), in metres. |
| dwc:habitat | A category or description of the habitat in which the Event occurred. |
| dwc:typeStatus | A list (concatenated and separated) of nomenclatural types (type status, typified scientific name, publication) applied to the subject. |
| dwc:waterBody | The name of the water body in which the Location occurs. |
| dwc:geodeticDatum | The ellipsoid, geodetic datum or spatial reference system (SRS) upon which the geographic coordinates given in decimalLatitude and decimalLongitude are based. |
Additional information
Discussion
The project had a tight timeframe: we had a four-month period to create inventory records, image and transcribe an estimated 10,000 specimens. During the project, we recorded 138 person days of digitiser effort, split amongst three digitisers. The creation of the stub-records and imaging was successfully completed within this period, but the transcription of such a large number of specimens required more time. The digitisation rate for creating inventory records and the specimen imaging met our expectations of creating an average of 400 records and imaging ca. 380 specimens per day (Table
When planning the project, we expected that approximately 75% of our collection will be from the ODA-listed countries. The original estimate was based on the collections of RBGK and we assumed that the collection localities would be similar. Following digitisation and data capture, we found that the ODA-listed countries covered only 31.8% of the NHM collection. We discovered that we have a large number of specimens from Mexico, South Africa, Angola and Thailand, all of which are not on the ODA list. The discrepancy between the original estimate of ~ 75% of material from ODA-listed countries versus the actual figure of 31.8% is likely due to historical differences in our collections and acquisitions compared with RBGK. While we expected some level of difference, this was greater than we anticipated. As collections are organised by taxon, it is hard to make predictions on collection locality without extensive random sampling or understanding systematic patterns like those seen with collectors. This is a factor we hope to better estimate in future digitisation projects.
Our transcription efforts were focused on only the five most crucial aspects of the collecting information associated with herbarium specimens. These were: the taxonomy (i.e. the name under which the specimen is filed in the herbarium, not just the name on the label which is sometimes different), the name of the person or the people who collected the specimen, the collection number under which it was recorded, the collection date or date ranges and, finally, the country of collection and the precise details of the collecting site. These data are vital, not only for the corresponding records to be findable in our Collections Management System, but to better inform us about any temporal or spatial changes to global biodiversity due to climate change or through any other factors. The labels associated with the herbarium specimens, however, often contain a much wider range of information than these five key elements, most commonly habitat description, vernacular names, local uses and occasionally even a cooking recipe if the plant is eaten by native people. We did not transcribe this type of information as it was not required for our project and we have to prioritise data capture, based on project requirements due to the scale of our collections. However, it can still be extracted from the associated images and might be of use to all sorts of other research projects, such as ecological or ethnobotanical studies.
As is typical for older natural history specimens, some of the transcribed data include historical regions or countries. While we have general point-radius coordinates with high uncertainty for modern countries, we do not have this for historical regions. We recognise that this is potentially valuable data and could lead to inaccurate interpretations (e.g. wrongly intepreting the locality "Congo" as the modern day Democratic Republic of the Congo). This issue has been previously identified as a community challenge by
An interesting, but perhaps unsurprising, finding is that our collection seems to be strongly male dominated. There are only two women (Caroline Whitefoord and Ynes Mexia) in the list of our top 50 plant collectors (Table
Overall, we consider the project successful given we had four months and three members of staff to digitise 11,222 herbarium specimens. The Covid-19 induced lockdown, despite its negative impact on many aspects of our private and professional lives, was also ironically rather fortuitous as it enabled us to transcribe and georeference all the digital records generated though this project from our homes. This proves that digitising the herbarium specimens at an inventory level first and then enhancing these records with more detailed or project-specific data some time later might be the way forward for any future large-scale digitisation endeavours which will require vast numbers of specimens to be processed as quickly and as effectively as possible. We also hope that the results of our work presented here will help other herbarium professionals better plan for their own digitisation projects.
Finally, as part of the publication process, this manuscript failed the initial technical validation using the original dataset which is a live version hosted on our insitutional data portal (
Definitions
- CMS: Collections management system, in reference to the NHMUK’s CMS which is currently Axiell's EMu.
- Data Portal: The NHMUK’s open access, open source data portal which provides an online human and machine-readable interface to the NHMUK’s collections. The collection data come from our CMS.
- GBIF: Global Biodiversity Information Facility. Global aggregator for biodiversity data. NHMUK provides data to GBIF via the Data Portal.
- Inventory record: the minimum information digital record of a herbarium specimen consisting of a unique barcode identifier, the taxonomic name under which the specimen is filed in the collection and the herbarium region under which it is curated.
- NHMUK: Natural History Museum, London. Partner on this project.
- ODA: Official Development Assistance. UK government aid programme targeting the economic development and welfare of developing countries.
- RBGK: Royal Botanic Gardens, Kew. Lead on this project.
- RBGE: Royal Botanic Garden Edinburgh. Partner on this project.
Appendix
ODA-listed Countries
African: Guinea, Ethiopia, Sudan, Kenya, Uganda, Tanzania, Mozambique, Malawi and Madagascar.
Asian: Bangladesh, Myanmar, Nepal, New Guinea and India.
Southern and Central American: Guatemala, Honduras, El Salvador, Nicaragua, Bolivia, Argentina and Brazil.
The following least-developed or low-income countries are official partners in GBIF: Benin, Central African Republic, DRC Congo, Guinea, Kenya, Madagascar, Malawi, Mauritania, Niger, South Sudan, Tanzania, Togo, Uganda and Zimbabwe.
Geographical regions
All plant genera at the BM Herbarium are curated using a unique system of 26 biogeographical regions:
- Europe
- Western Asia
- North Asia
- Japan
- China
- India
- Indochina
- Malesia
- West African Islands
- North Africa
- Tropical Africa
- South Africa
- South African Islands
- Madagascar
- Mascarenes
- Australia
- New Zealand
- New Caledonia
- Polynesia
- North America
- Central American Continent
- West Indies
- Tropical South America
- Brazil
- Temperate South America
- Antarctica
Acknowledgements
We would like to thank the following people and teams: Louise Allan (0000-0002-5148-002X) for project management support; the general support of the curators of the NHM General Herbarium (BM); the NHM Data Management Team, especially Hillery Warner (0000-0002-4956-9797) who helped with bulk import and updating of specimen data; our colleagues at the Royal Botanic Gardens, Kew and the Royal Botanic Garden Edinburgh. We also thank Helen Hardy (0000-0002-9206-8357) for proof reading and commenting on the manuscript.
Author contributions
Krisztina Lohonya: Data curation, Formal analysis, Investigation, Methology, Writing - original draft. Laurence Livermore: Conceptualisation, Funding acquisition, Project administration, Writing - review & editing. Jacek Wajer:* Data curation, Methology, Supervision. Elizabeth Devenish:** Investigation, Writing - review & editing. Robyn Crowther:*** Data curation, Investigation, Writing - review & editing.
Contribution types are drawn from CRediT - Contributor Roles Taxonomy.
*Also includes curatorial support and providing technical specifications. **Imaging of herbarium specimens. ***Imaging of the specimens, transcription and geo-referencing.
References
- A complete digitization of German herbaria is possible, sensible and should be started now.Research Ideas and Outcomes6https://doi.org/10.3897/rio.6.e50675
- Enhancement of conservation knowledge through increased access to botanical information.Conservation Biology33(3):523‑533. https://doi.org/10.1111/cobi.13291
- Global conservation priorities for crop wild relatives.Nature Plants2(4). https://doi.org/10.1038/nplants.2016.22
- Mukula (rosewood) trade between China and Zambia.CIFOR InfobriefURL: https://www.cifor.org/publications/pdf_files/infobrief/6880-infobrief.pdf
- Expounding the Value of Grain Legumes in the Semi- and Arid Tropics.Sustainability9(1). https://doi.org/10.3390/su9010060
- Appendices I, II and III. https://cites.org/eng/app/appendices.php. Accessed on: 2021-7-23.
- The CITES Appendices. https://cites.org/eng/app/index.php. Accessed on: 2022-9-02.
- Darwin Core quick reference guide. http://rs.tdwg.org/dwc/terms/. Accessed on: 2022-8-15.
- https://stories.rbge.org.uk/archives/31041. Joint digitisation project. Accessed on: 2021-10-23.
- Definition and classification of commodities. 4. Pulses and derived products.https://www.fao.org/es/faodef/fdef04e.htm. Accessed on: 2021-7-23.
- Digitisation at Three UK Herbaria Contributes Towards Food Security and Sustainable Timber Use.Biodiversity Information Science and Standards3https://doi.org/10.3897/biss.3.37092
- Developing integrated workflows for the digitisation of herbarium specimens using a modular and scalable approach.ZooKeys209:93‑102. https://doi.org/10.3897/zookeys.209.3121
- Saving rosewoods, one datapoint at a time.https://www.kew.org/read-and-watch/saving-rosewoods-data. Accessed on: 2021-10-23.
- Tropical hardwood flows in China: Case studies of rosewood and okoumé.Forest Trends, Center for International Forestry Research and World Agroforestry CentreURL: https://www.forest-trends.org/wp-content/uploads/imported/tropical-hardwood-flows-in-china-v12_12_3_2013-pdf.pdf
- Dataset: Defra ODA Legumes Project. Natural History Museum Data Portal (data.nhm.ac.uk). URL: https://doi.org/10.5519/0073006
- Quality issues in georeferencing: From physical collections to digital data repositories for ecological research.Diversity and Distributions27(3):564‑567. https://doi.org/10.1111/ddi.13208
- Harnessing the potential of integrated systematics for conservation of taxonomically complex, megadiverse plant groups.Conservation Biology33(3):511‑522. https://doi.org/10.1111/cobi.13289
- Mapping the history of botanical collectors: spatial patterns, diversity, and uniqueness through time.Systematics and Biodiversity16(1):1‑13. https://doi.org/10.1080/14772000.2017.1355854
- The Natural History Museum Data Portal.Database2019https://doi.org/10.1093/database/baz038
- Orphan legume crops enter the genomics era!Current Opinion in Plant Biology12(2):202‑210. https://doi.org/10.1016/j.pbi.2008.12.004
- Dalbergia nigra (errata version published in 2016). The IUCN Red List of Threatened Species 1998. https://dx.doi.org/10.2305/IUCN.UK.1998.RLTS.T32985A9741135.en. Accessed on: 2022-2-18.
- Darwin Core: An Evolving Community-Developed Biodiversity Data Standard.PLoS ONE7(1). https://doi.org/10.1371/journal.pone.0029715
Supplementary materials
A list of all countries represented in our dataset with the corresponding numbers of specimens.
A list of all collectors represented in our dataset and the numbers of the specimens contributed by them.
A bar chart representation of the number of records from each country.
The majority of the NHMUK herbarium sheets are stored in cabinets with shelves. The sheets are organised in folders and arranged by genera, geographic regions and species. The order of species within the herbarium is mixed with some sections using historical treatments/monographs, while recently-curated sections have switched to using alphabetical organisation. There was a mix of sheet organisation in the sections included in this project.